Get access to all lessons in this course.
-
Advanced Data Wrangling
- Downloading and Importing Data
- Overview of Tidy Data
- Tidy Data Rule #1: Every Column is a Variable
- Tidy Data Rule #3: Every Cell is a Single Value
- Tidy Data Rule #2: Every Row is an Observation
- Changing Variable Types
- Dealing with Missing Data
- Advanced Summarizing
- Binding Data Frames
- Functions
- Data Merging
- Exporting Data
- Bring It All Together (Advanced Data Wrangling)
-
Advanced Data Visualization
- Best Practices in Data Visualization
- Tidy Data
- Pipe Data into ggplot
- Reorder Plots to Highlight Findings
- Line Charts
- Use Color to Highlight Findings
- Declutter
- Add Descriptive Labels to Your Plots
- Use Titles to Highlight Findings
- Use Annotations to Explain
- Tweak Spacing
- Create a Custom Theme
- Customize Your Fonts
- Try New Plot Types
- Bring it All Together (Advanced Data Visualization)
-
Quarto
- Advanced Markdown
- Advanced YAML and Code Chunk Options
- Tables
- Inline R Code
- Making Your Reports Shine: Word Edition
- Making Your Reports Shine: PDF Edition
- Making Your Reports Shine: HTML Edition
- Presentations
- Dashboards
- Websites
- Publishing Your Work
- Quarto Extensions
- Parameterized Reporting, Part 1
- Parameterized Reporting, Part 2
- Parameterized Reporting, Part 3
- Wrapping up Going Deeper with R
Going Deeper with R
Declutter
This lesson is locked
This lesson is called Declutter, part of the Going Deeper with R course. This lesson is called Declutter, part of the Going Deeper with R course.
If the video is not playing correctly, you can watch it in a new window
Transcript
Click on the transcript to go to that point in the video. Please note that transcripts are auto generated and may contain minor inaccuracies.
FYI, as you go through this lesson, I only begin to touch on working with the theme() function to customize plots, as I only really want to focus on teaching you how to remove things using element_blank(). However, there is a ton to learn here so definitely check out the Learn More section below!
Your Turn
Use some combination of:
Complete themes: e.g.
theme_minimal()ortheme_ipsum()fromhrbrthemesThe
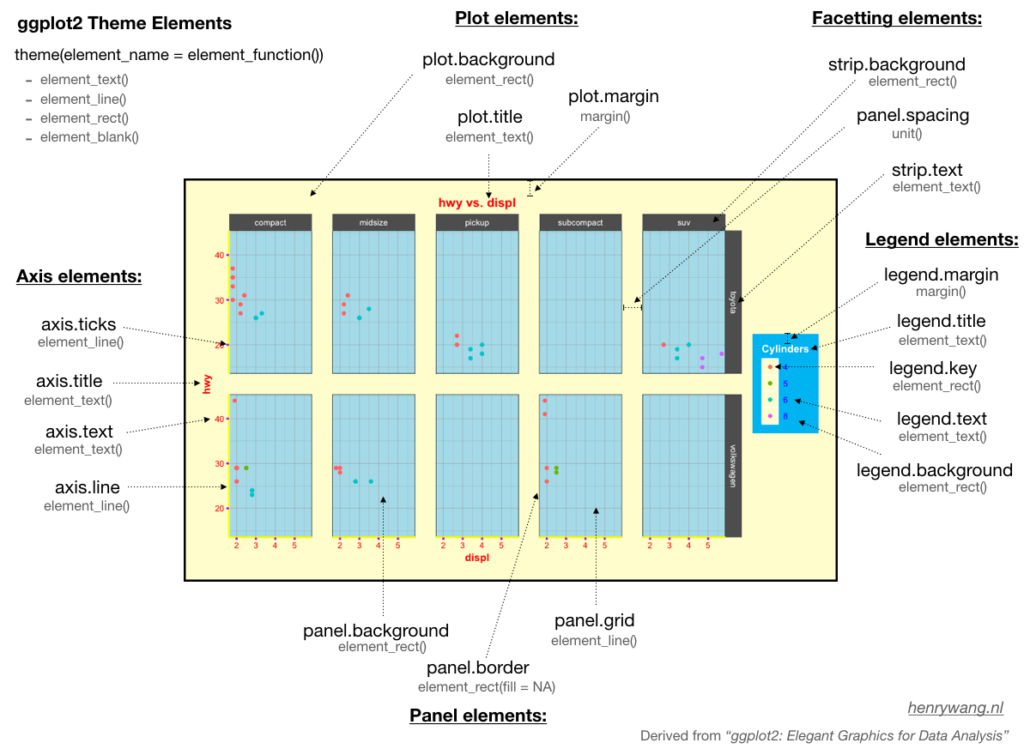
theme()function (see the diagrams by Henry Wang for a great reference)
Do the following:
Remove gray background
Remove axis titles
Remove or minimize grid lines
Learn More
The theme reference page I mention throughout the video can be found on the ggplot website. That will provide you a great reference of everything you can do with the theme() function.
Henry Wang has put together some really nice visuals to help you understand working with themes.
Editing ggplot theme elements can be confusing. You might consider checking out the ggeasy package, which aims to make doing common things much simpler.
Finally, if you’re confused by the idea of “complete” themes, the best description of them comes from the ggplot website:
These are complete themes which control all non-data display. Use
theme()if you just need to tweak the display of an existing theme.
You need to be signed-in to comment on this post. Login.
Jodi Fender
May 11, 2021
I have a font I use for a project of mine (various from Whitney family), but it was stating font family not found in Windows font database. But...now every time I run the code for the new graph (not specifying any font) but using hrbrthemes/theme_ipsum I get, Warning (yellow triangle) font family not found in Windows font database font family not found in Windows font database font family not found in Windows font database font family not found in Windows font database font family not found in Windows font database font family not found in Windows font database font family not found in Windows font database font family not found in Windows font database
Jody Oconnor
May 11, 2021
Missing font families came up in a previous lesson, but was put off for later. Now that we're back making charts pretty, I'd like to know how to access specific fonts (maybe this is covered in a later lesson...?)
When I run: theme(axis.title.x = element_blank(), axis.text = element_text(family = "ariel", size = 15),
within ggplot, I get a chart but the font seems to be the default still, and the error message shows at the top (regardless of the font name I include): Warning font family not found in Windows font database font family not found in Windows font database font family not found in Windows font database font family not found in Windows font database
Oindrila Bhattacharyya
May 13, 2021
When I try running library(ragg), it says "there is no package called 'ragg' ". Can you tell me why? Also I am getting the same error messages for font like others.
Matt M
December 5, 2021
I was playing with hrbrthemes and was trying to manipulate the justification of the axis titles in theme_ipsum.
in the ?theme_ipsum Help file it returns: "axis_title_just axis title font justification, one of [blmcrt]"
?blmcrt said there’s not documentation. Googling blmcrt didn’t reveal anything. Setting axis_title_just = FALSE made it centered, not right justified. but the way [blmcrt] is shared in the help file, it seems like that refers to something fundamental that I should know.
Sara Kidd
February 5, 2022
I haven't been able to resolve the font issue yet. I have a Mac. I installed the Whitney font that someone mentioned above to test. I installed ragg and systemfont. I made sure to install Whitney to the computer and not just the user (which at first I thought was the problem). I can switch between fonts that were already installed like Georgia, Gill Sans, etc. But if i try theme_ipsum(base_family = "Whitney") I get the error:
Warning in grid.Call(C_textBounds, as.graphicsAnnot(x$label), x$x, x$y, : no font could be found for family "Whitney" Error in grid.Call(C_textBounds, as.graphicsAnnot(x$label), x$x, x$y, : polygon edge not found
Hatem Kotb
January 15, 2023
Hi could you please let me know whether my understanding here is correct?
Jeremy Danz
February 6, 2023
Hmm, any idea why when using theme_ipsum, and setting the axis_title_size = 0, it looks like the axis titles are still there, but just very very small?
When using theme_minimal and theme(axis.title = element_blank()) the axis titles appear gone completely.
Here's a screenshot of what I'm getting with theme_ipsum https://imgur.com/eZufC8N
I appear to be getting the same font issue that others are getting, which looks fixable, but also not particularly awful if it isn't fixed? everything seems to work still, it just throws an unpleasant looking error message?
thanks!
Zain Asaf
June 12, 2023
I have attempted to remove grid lines using the following line of code: pannel.grid.minor.y = element_blank()) However, I get the following error message: Error in
mapply(): ! Thepannel.grid.minor.ytheme element is not defined in the element hierarchy.