Get access to all lessons in this course.
-
Advanced Data Wrangling
- Downloading and Importing Data
- Overview of Tidy Data
- Tidy Data Rule #1: Every Column is a Variable
- Tidy Data Rule #3: Every Cell is a Single Value
- Tidy Data Rule #2: Every Row is an Observation
- Changing Variable Types
- Dealing with Missing Data
- Advanced Summarizing
- Binding Data Frames
- Functions
- Data Merging
- Exporting Data
- Bring It All Together (Advanced Data Wrangling)
-
Advanced Data Visualization
- Best Practices in Data Visualization
- Tidy Data
- Pipe Data into ggplot
- Reorder Plots to Highlight Findings
- Line Charts
- Use Color to Highlight Findings
- Declutter
- Add Descriptive Labels to Your Plots
- Use Titles to Highlight Findings
- Use Annotations to Explain
- Tweak Spacing
- Create a Custom Theme
- Customize Your Fonts
- Try New Plot Types
- Bring it All Together (Advanced Data Visualization)
-
Quarto
- Advanced Markdown
- Advanced YAML and Code Chunk Options
- Tables
- Inline R Code
- Making Your Reports Shine: Word Edition
- Making Your Reports Shine: PDF Edition
- Making Your Reports Shine: HTML Edition
- Presentations
- Dashboards
- Websites
- Publishing Your Work
- Quarto Extensions
- Parameterized Reporting, Part 1
- Parameterized Reporting, Part 2
- Parameterized Reporting, Part 3
- Wrapping up Going Deeper with R
Going Deeper with R
Reshaping Data
This lesson is locked
This lesson is called Reshaping Data, part of the Going Deeper with R course. This lesson is called Reshaping Data, part of the Going Deeper with R course.
If the video is not playing correctly, you can watch it in a new window
Transcript
Click on the transcript to go to that point in the video. Please note that transcripts are auto generated and may contain minor inaccuracies.
Your Turn
Start with the
enrollment_18_19data frameselect()thedistrict_idvariable as well as those about number of students by race/ethnicity and get rid of all others (hint: use thecontains()helper function withinselect())Use
pivot_longer()to convert all of the race/ethnicity variables into one variableWithin
pivot_longer(), use the names_to argument to call that variablerace_ethnicityWithin
pivot_longer(), use the values_to argument to call that variablenumber_of_students
Learn More
The best place to learn more about pivot_longer() and pivot_wider() is the pivoting vignette from the tidyr package.
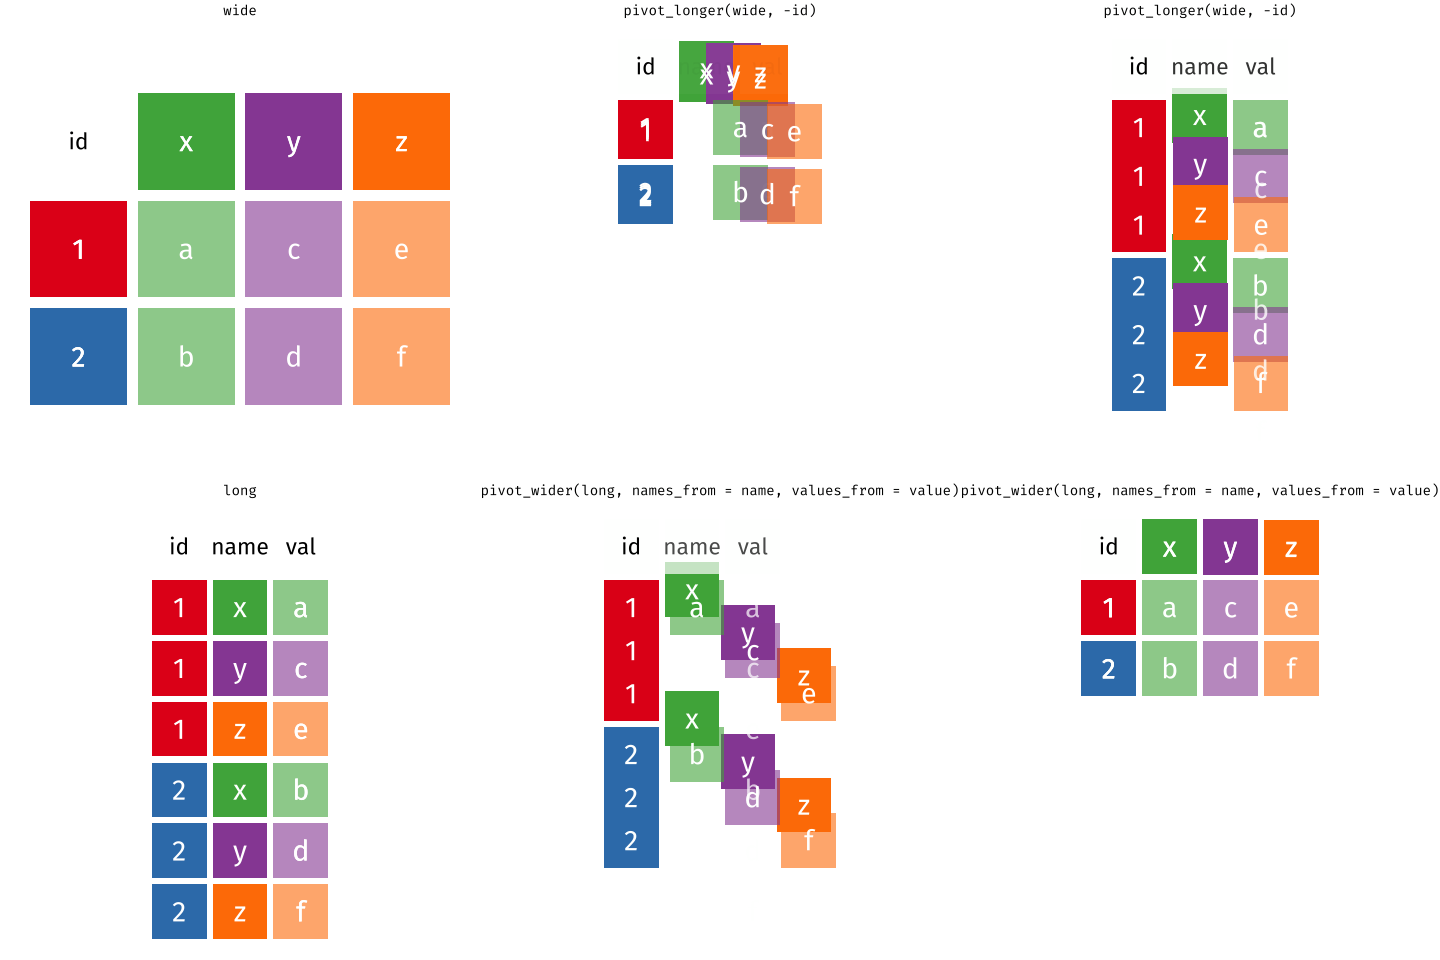
There’s also a nice article by Gavin Simpson of University College, London about pivoting. That article includes the animations below, made by Garrick Aden-Buie and Mara Averick, that gave a visual demonstration of pivoting.
RStudio has a nice primer on reshaping data, complex with a few exercises.
Finally, a heads up: if you ever see references to the functions gather() and spread(), these are the previous iterations of the pivot functions. They still work (as the tweet below from tidyverse developer Hadley Wickham indicates), but the pivot functions are, in my view (and the view of many others), much easier to use.
You may have heard a rumour that gather/spread are going away. This is simply not true (they’ll stay around forever) but I am working on better replacements which you can learn about at https://t.co/sU2GzWeBaf. Now is a great time for feedback! #rstats
— Hadley Wickham (@hadleywickham) March 19, 2019


You need to be signed-in to comment on this post. Login.
IBRAH SENINDE
April 22, 2021
Hi David, I typed the following code, but the new data frame still the original structure. What could be the problem? enrollment_by_race_ethnicity_18_19 % select(-contains("grade")) %>% select(-contains("kindergarten")) %>% select(-contains("percent")) %>% pivot_longer(cols = "district_id", names_to = "race_ethnicity", values_to = "number_of_students")
Harold Stanislaw
April 22, 2021
I used select(!contains ("percent")) instead of select(-contains ("percent")), mainly because the helper page listed the exclamation option rather than the minus sign. Are there any differences between the two?
Matt M
November 9, 2021
I only have enrollment_17_18 and enrollment_18_19 files. Where did the math scores files come from that is shown at 5:40 of this lesson? My code matches what's in the Solutions for the Importing Data lesson and I don't think there was anything we downloaded in the Tidy Data lesson.
Alberto Espinoza
September 10, 2022
Hi David, is there a way to enter the name of each column we want to remove within one select(-contains(" ")) argument rather than writing each one separately?
Nadia Chang
November 24, 2022
Hi David! by using pivot_longer it means that it will always arrange the data by 3 columns?