
What’s New in R: September 8, 2026
Welcome to this week's edition of What's New in R! This week, we're featuring a book on crafting beautiful slides with Quarto and Reveal.js, a side-by-side reference for translating between data manipulation styles in R and Python, and a new package for making poster-worthy maps of your favorite city. Let's dive in!
Slidecrafting
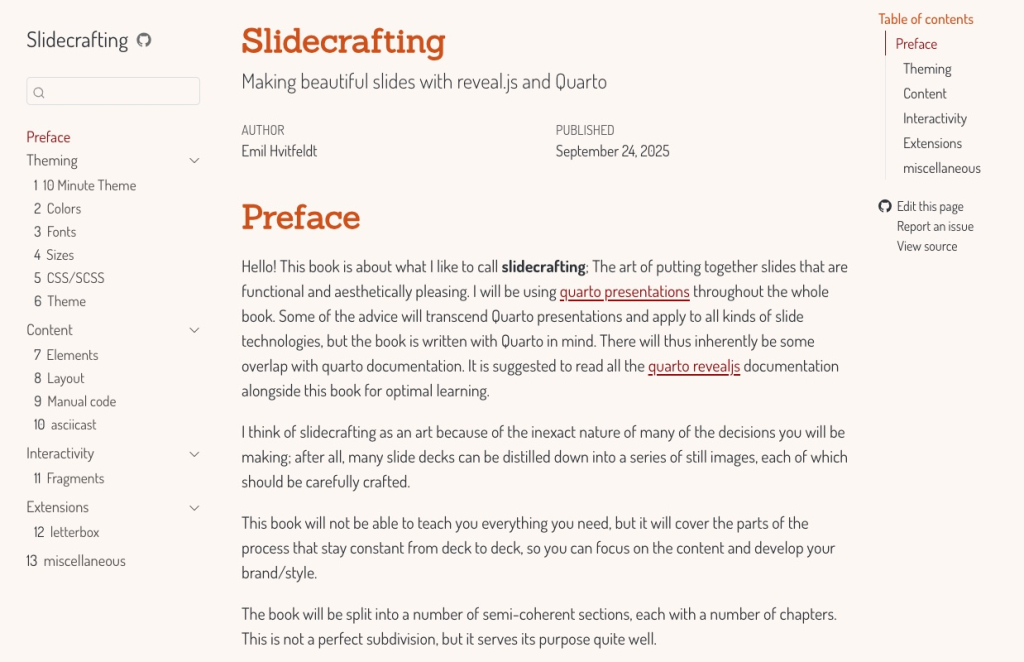
Emil Hvitfeldt has written a whole book on slidecrafting: making functional and beautiful Quarto Reveal.js presentations. It goes into great detail across theming (colors, fonts, CSS and SCSS), content and layouts, interactivity with fragments and auto-animate, and extensions that add even more polish. If you make slides with Quarto, or have been meaning to move beyond the defaults, this is a fantastic resource to have on hand. Emil's presentations are always gorgeous, so it's great to see how he does it all laid out in one place.
data.table, base, dplyr, pandas, and polars
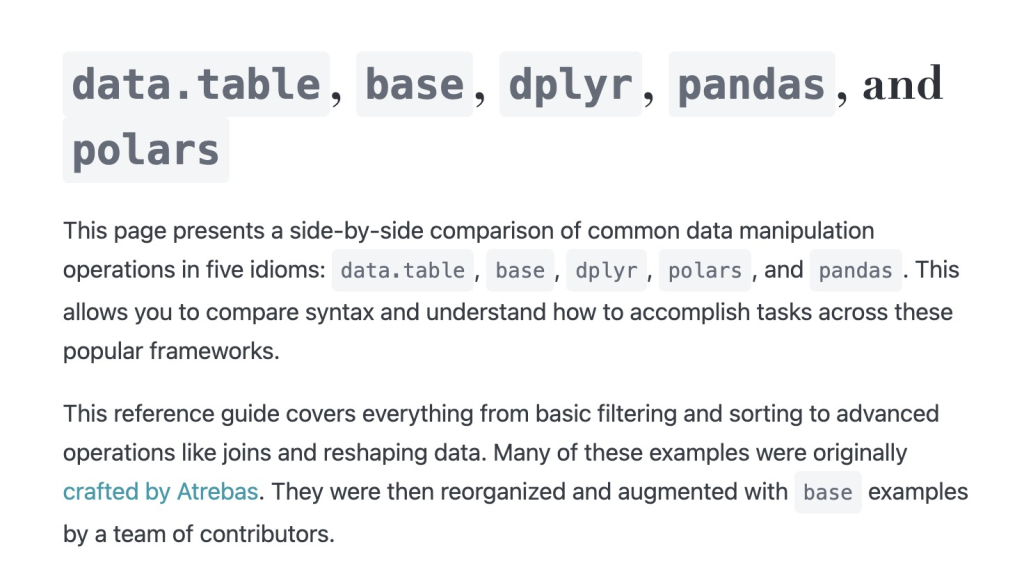
Vincent Arel-Bundock has put together a really nice side-by-side reference comparing five different styles of data manipulation: base R, {dplyr}, {data.table}, and the pandas and polars libraries from Python. Each common operation (filtering, sorting, grouping and summarizing, joins, reshaping, and more) is shown in all five approaches at once, so you can see exactly how something you know in one translates to the others. If you use base R but want to see the {dplyr} equivalent, or you're moving between R and Python, this is a great page to bookmark. It's the kind of resource you'll come back to again and again.
cartographr
The {cartographr} package by David Willinger makes it easy to create really nice maps of cities, the kind of thing you might want to print out and hang on your wall. It provides a lightweight interface between {osmdata} and {ggplot2}, pulling in OpenStreetMap data and styling it with one of 15 built-in color palettes (or your own custom palette). There are thoughtful print-focused touches too, like scaling text and lines to your chosen output size and saving print-ready PDFs. If you've admired those minimalist city map posters, now you can make your own in R.
If you enjoyed this issue of What’s New In R, please share it with a friend! And if they want to get What’s New in R directly in their inbox, they can sign up on the R for the Rest of Us website.
Got any ideas for resources I should feature in future issues of What’s New in R? Leave a comment below!
Sign up for the newsletter
Get blog posts like this delivered straight to your inbox.



You need to be signed-in to comment on this post. Login.