
What’s New in R: October 13, 2026
Welcome to this week's edition of What's New in R! This week, we're featuring a package that writes alt text for your ggplot2 charts automatically, a package for downloading administrative boundaries for any country, and a gorgeous scrollytelling map of nearly 6,000 castles made with Quarto. Let's dive in!
ggalttext
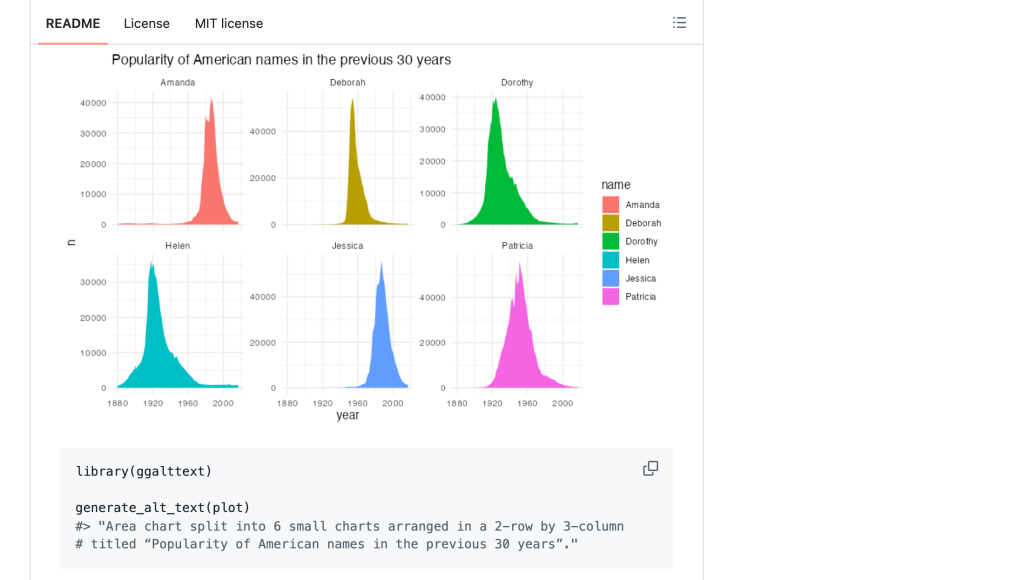
The {ggalttext} package by Joseph Barbier automatically generates alternative text for {ggplot2} charts, which is a big help for accessibility since alt text is one of those things that's easy to skip. Its generate_alt_text() function inspects the plot object itself (the geoms, layers, facets, titles, and so on) and returns a description like 'Area chart split into 6 small charts arranged in a 2-row by 3-column grid, titled...'. Notably, it doesn't use any AI or OCR, so the output is fast and deterministic. There's also enable_auto_alt_text(), which applies alt text to every chart in a Quarto document, and it supports English, French, and German.
geobounds
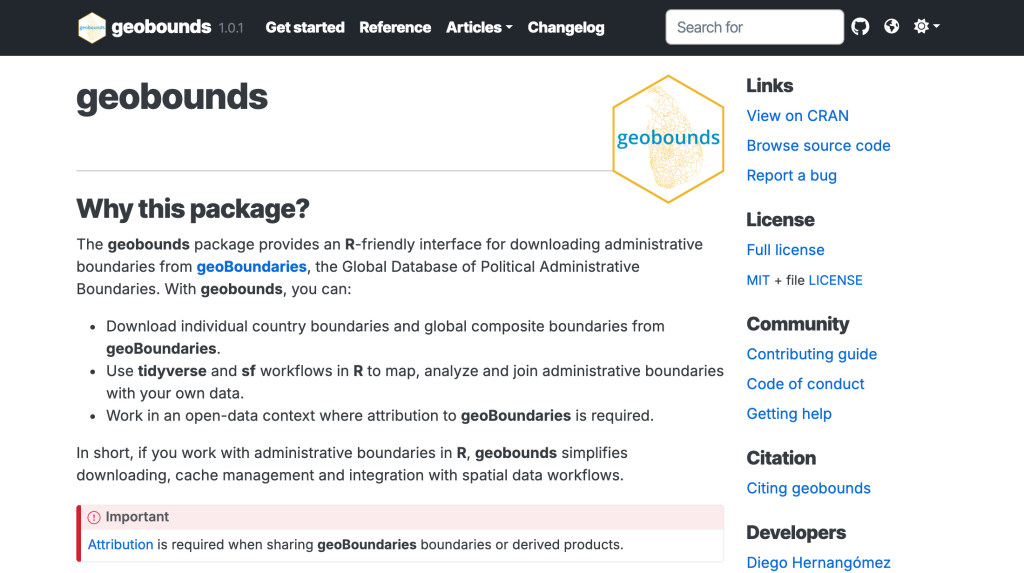
The {geobounds} package by Diego Hernangómez gives you an easy way to download administrative boundaries from geoBoundaries, the global database of political administrative boundaries maintained by William & Mary's geoLab. Functions like gb_get_adm1(), gb_get_adm2(), and gb_get_adm3() return boundaries for a country at the level you need as {sf} objects, ready for mapping and spatial analysis, and gb_get_world() gets you global composites. It handles caching automatically and lets you choose between the open, humanitarian, and authoritative releases. If you've struggled to find consistent boundary data for countries outside the US, this is a really useful package to know about.
An atlas of stone
Deepali Kank built this beautiful scrollytelling map of 5,793 castles, fortresses, palaces, and ruins across 138 countries, using the Castlemap dataset from TidyTuesday. As you scroll, the map flies from a global view to Europe (where France, Italy, and Germany are separated by just two landmarks), on to the Great Wall of China, Japan, and India, and finally to the dataset's 1,180 fortresses, with a thoughtful note that gaps on the map often reflect gaps in documentation rather than in history. It's made with Quarto and published on Posit Connect Cloud, and you can hover any point to see its photo. This is a lovely example of how far you can push a data story with Quarto.
If you enjoyed this issue of What’s New In R, please share it with a friend! And if they want to get What’s New in R directly in their inbox, they can sign up on the R for the Rest of Us website.
Got any ideas for resources I should feature in future issues of What’s New in R? Leave a comment below!
Sign up for the newsletter
Get blog posts like this delivered straight to your inbox.



You need to be signed-in to comment on this post. Login.