
What’s New in R: November 9, 2026
Welcome to this week's edition of What's New in R! This week, we're featuring a video explaining what Parquet files are and why they're so good, a new font and theme in one of my favorite ggplot2 theme packages, and a Sankey diagram showing just how much "avocado oil" isn't actually avocado oil. Let's dive in!
What is a Parquet file anyway? Why is Parquet good?

If you've heard people rave about Parquet files but never quite understood why, this episode of Posit's Data Science Lab is for you. Nic Crane, co-author of Scaling Up With R and Arrow, joins hosts Libby Heeren and Isabella Velásquez to explain what a Parquet file is: compared to a CSV, it's smaller, much faster to read and write, keeps your data types intact, and is stored by column, so you can read just the columns you need without loading the whole file. Nic walks through working with Parquet in R using {arrow} and {nanoparquet} and shows what it looks like to open one in Positron's Data Explorer. She's also published her notes from the session on her blog, which make a great companion to the video.
Adding Archivo SemiCondensed to {hrbrthemes}
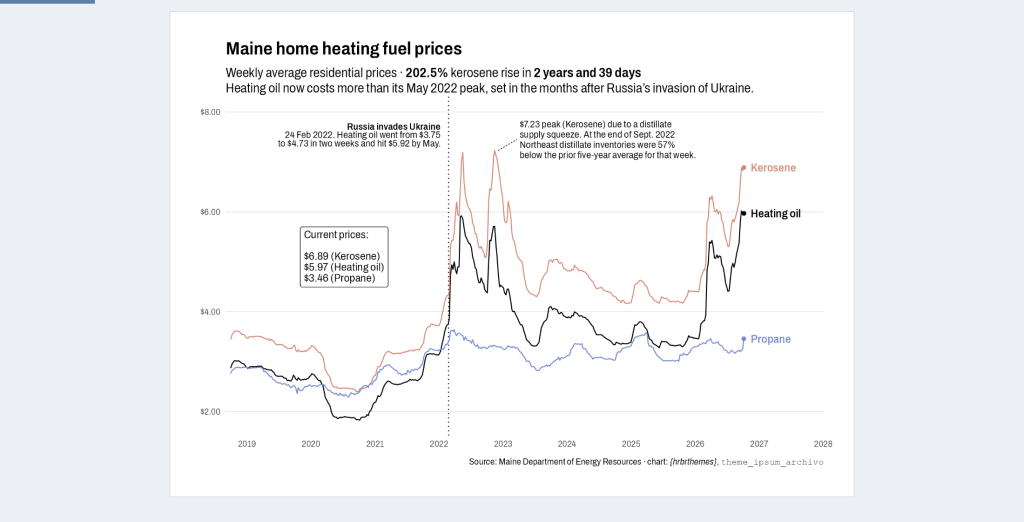
The {hrbrthemes} package by Bob Rudis has long been one of the best ways to make your {ggplot2} charts look good out of the box, and now it has a new font. Bob has added theme_ipsum_archivo(), built on the semi-condensed cut of Archivo, a typeface modeled on 19th-century American display type. In the post, he explains why it works so well for charts: its tall lowercase letters stay legible even at small sizes, the semi-condensed width fits long axis labels and annotations without collisions, and its tabular figures keep numbers lined up. He also added humanize_duration(), which turns a time span into readable text like '2 years and 39 days' for use in subtitles and annotations, and he shows it all in action with a chart of Maine heating fuel prices.
TidyTuesday 2026/41
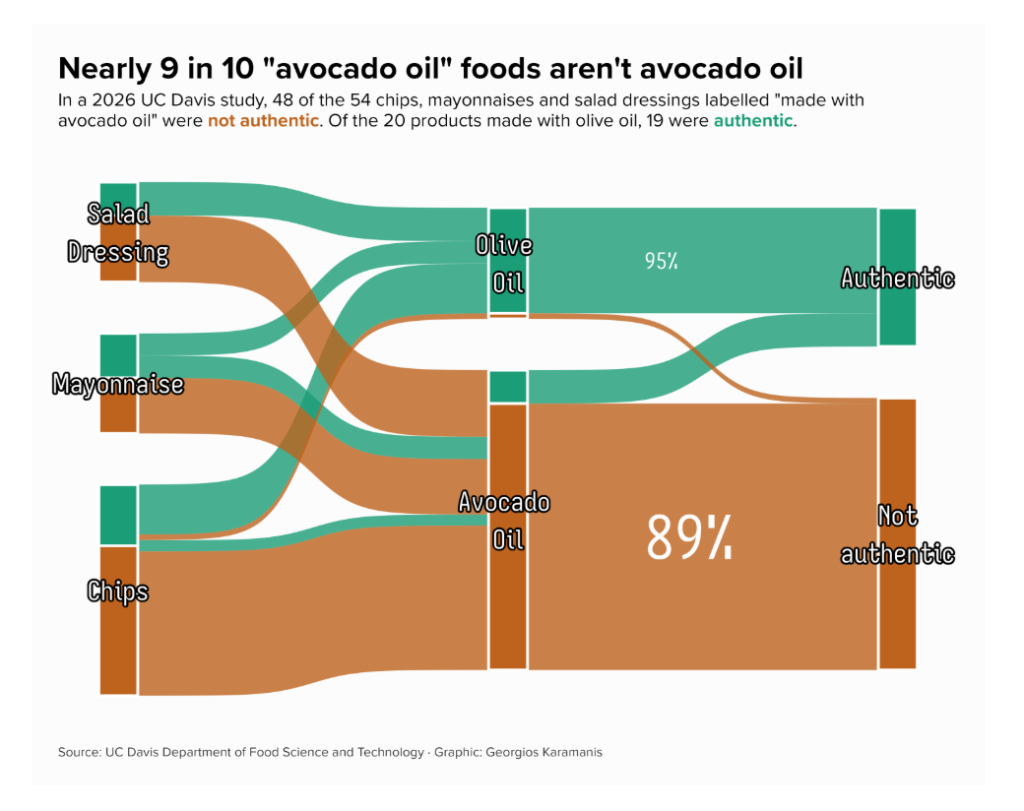
Georgios Karamanis consistently makes some of the most creative TidyTuesday visualizations around, and this one tells a surprising story. Using data from a UC Davis study of chips, mayonnaises, and salad dressings sold as 'made with avocado oil,' he found that 48 of the 54 avocado oil products were not authentic (89%), while 19 of the 20 olive oil products were the real thing. His Sankey diagram follows each product from its category to the oil on the label to the test result, splitting every bar and flow by the share of authentic products so the color shows the result at each step. As always, Georgios has shared the code on GitHub.
If you enjoyed this issue of What’s New In R, please share it with a friend! And if they want to get What’s New in R directly in their inbox, they can sign up on the R for the Rest of Us website.
Got any ideas for resources I should feature in future issues of What’s New in R? Leave a comment below!
Sign up for the newsletter
Get blog posts like this delivered straight to your inbox.



You need to be signed-in to comment on this post. Login.