Combining Quantitative and Qualitative Data to Report on Census Outreach Efforts
When Juan Clavijo, senior consultant at ORS Impact, emailed R for the Rest of Us in early 2020, he wanted to know if we could help with reports they were preparing on outreach efforts during the decennial U.S. Census. They would be producing over 50 reports and knew they needed help to automate the process.
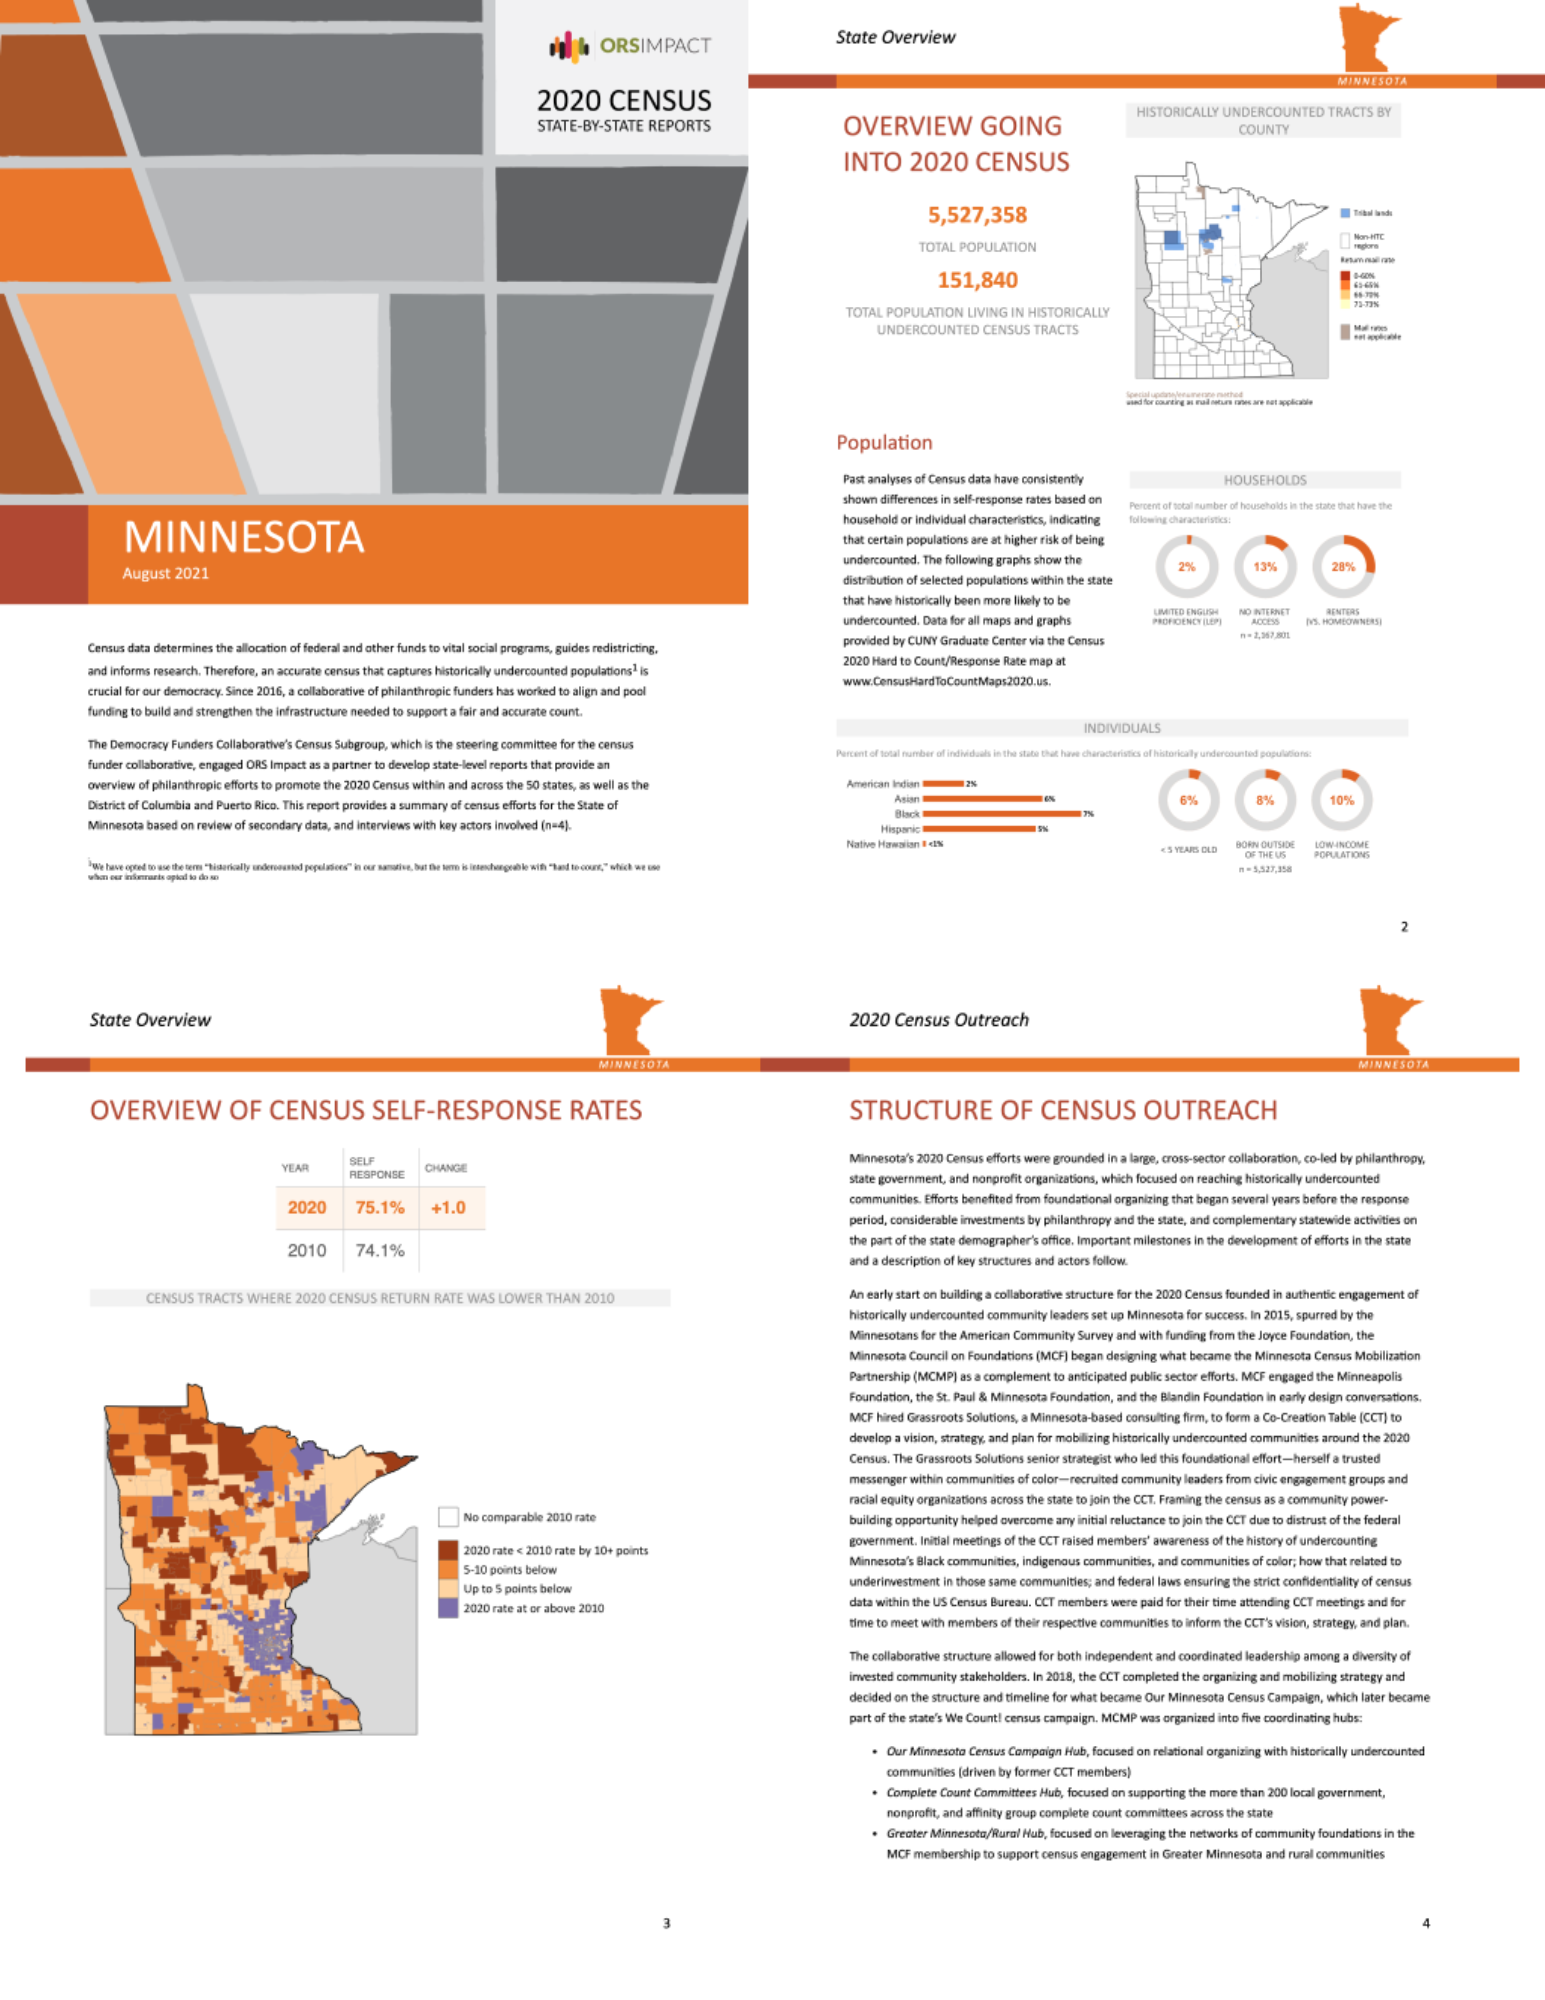
ORS Impact, a Seattle-based consulting firm, had partnered with the Democracy Funders Collaborative to identify, analyze, and report on a range of efforts across the country to ensure that all people were counted during the 2020 Census, specifically historically undercounted populations. The reports that would result from this project would be done for all U.S. states. In thinking about the manual work involved in producing these reports, the ORS team thought there had to be a better way.
One of the most challenging parts of the project was that the reports would combine both quantitative data (information on the size of so-called hard-to-count populations) and qualitative data (descriptions of how non-profits did on-the-ground outreach). The ORS team knew that R could handle the quantitative data. Could it also handle the qualitative data?
The answer, of course, was yes.
Working together with the R for the Rest of Us team, we developed a collaborative approach to developing these reports.
We set up a shared Google Drive folder where ORS staff posted both quantitative and qualitative data. We brought in the quantitative data, in the form of Excel spreadsheets, and combined it with other data sources to create high-quality charts and maps.
And we brought in the qualitative data in the form of Word documents that laid out descriptions of outreach efforts in each state. By creating a Word template that the ORS team used, the process of bringing in the qualitative data was completely automated. As ORS wrote up their findings for each state, the R for the Rest of Us team was able to generate reports in a matter of seconds. Not only that, but as ORS needed to make revisions, we re-created all new reports at once without needing to touch every individual report.
The 52 reports that came out of this project have helped ORS Impact and the Democracy Funders Network to achieve their goals — and more. The reports are attractive and communicate effectively, and were completed without the agonizing manual work that Juan and his team feared might be required. Working with quantitative and qualitative data, an automated process of report creation, an attractive and effective end product: it’s all possible when working with R.
Interested in learning more about our consulting services?
Drop us a line below.