What’s New in R: June 29, 2026
Welcome to this week's edition of What's New in R! This week, we're featuring a big update to a package for building advanced ggplot2 legends and guides, the highlights from Positron's latest release, and a fun statistical look at how long wars actually last. Let's dive in!
Symbolic update
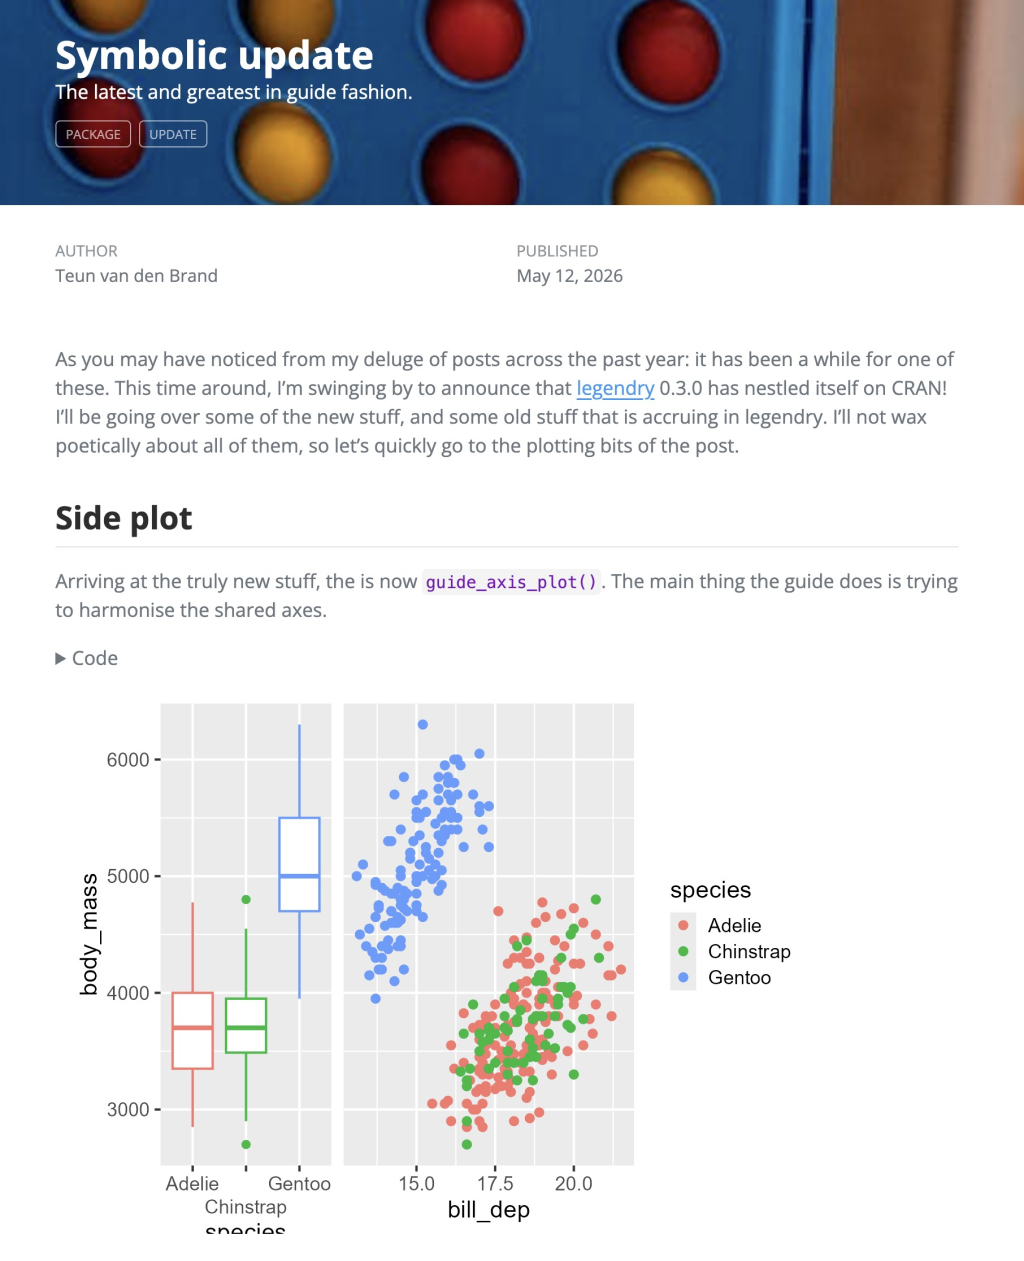
Teun van den Brand has released version 0.3.0 of {legendry}, his package for building advanced guides and legends in {ggplot2}. The update adds a whole batch of new guides, including guide_legend_manual() for custom legends that don't require a data mapping, guide_axis_upset() for showing set combinations as an alternative to Venn diagrams, and guide_axis_annotation() for dropping extra labels at specific positions. There are also new styling options that give you granular control over how breaks look. If the standard {ggplot2} legend isn't doing what you need, this package is well worth a look.
Positron May Release Highlights
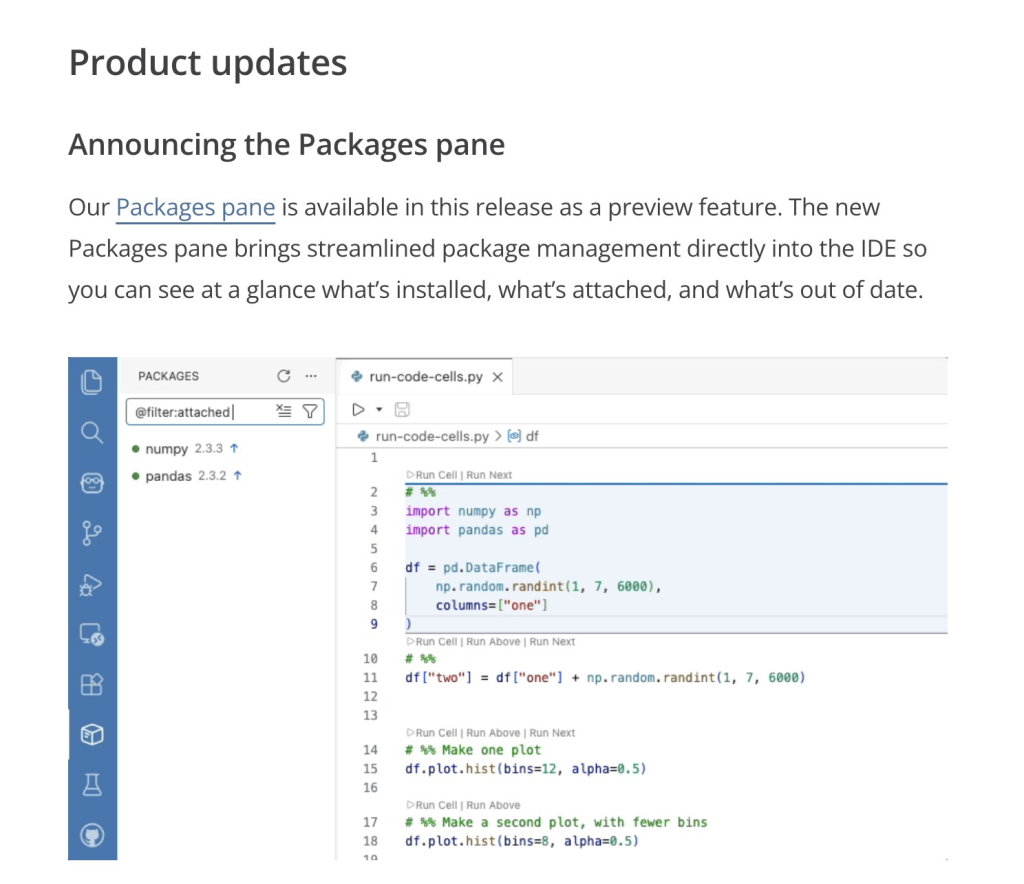
Julia Silge runs through the highlights of Positron's May release, and there's a lot to like. The one I'm most excited about is the new Packages pane, which lets you see your installed, attached, and outdated packages at a glance, with support for base R, pak, and renv (plus the Python equivalents). Other additions include inline output for .qmd documents, the Notebook Editor moving from alpha to beta, and new Posit AI options built right into the editor. If you're using Positron, this is a great rundown of what's new.
Durations of wars
Peter Ellis uses the Correlates of War dataset, covering inter-state wars from 1823 to 2003, to ask a deceptively simple question: how long do wars tend to last? Along the way he walks through some genuinely nice R code, using the tidyverse, {lubridate}, and {ggrepel} alongside techniques like empirical cumulative distribution functions and LOESS smoothing. The findings are interesting in their own right: the median inter-state war runs about 139 days, and war duration shows no clear trend across nearly two centuries. Even if the subject matter is heavy, it's a great example of using real data and clear visualization to explore a question.
If you enjoyed this issue of What’s New In R, please share it with a friend! And if they want to get What’s New in R directly in their inbox, they can sign up on the R for the Rest of Us website.
Got any ideas for resources I should feature in future issues of What’s New in R? Leave a comment below!
Sign up for the newsletter
Get blog posts like this delivered straight to your inbox.

You need to be signed-in to comment on this post. Login.