What’s New in R: June 8, 2026
Welcome to this week's edition of What's New in R! This week, we're featuring a package for compositing ggplot graphics into images with perspective and transparency, a video from Posit announcing their new AI tooling for Positron and RStudio, and a practical guide to map projections in R. Let's dive in!
{overlay}
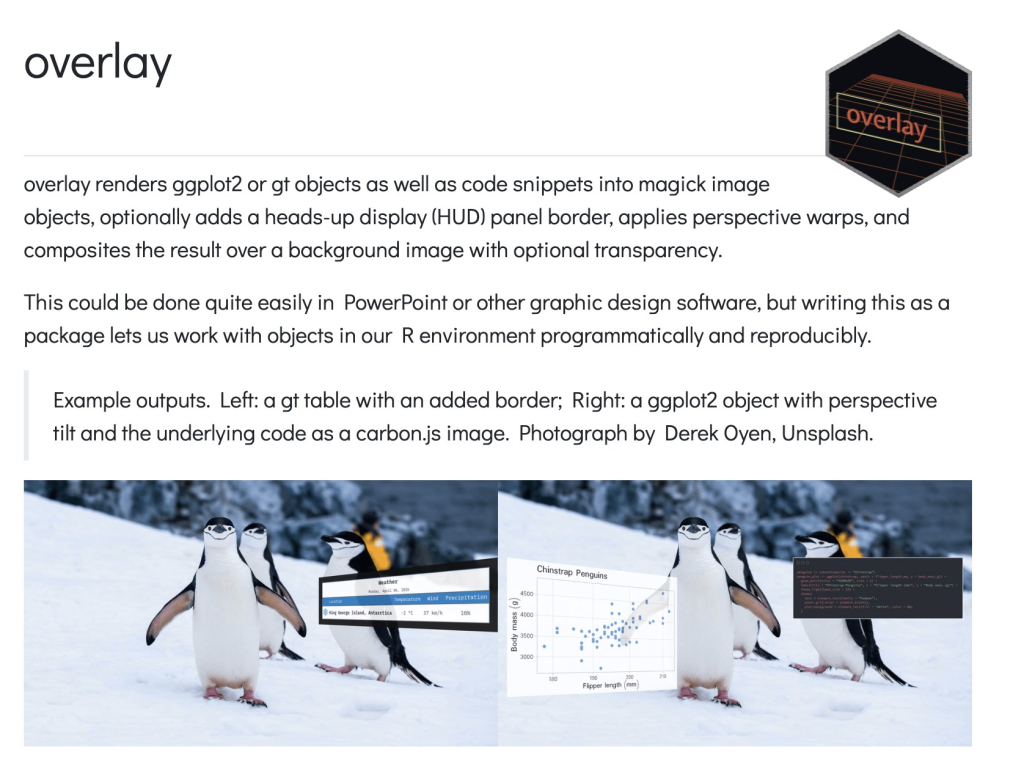
{overlay}, created by Luis D. Verde Arregoitia, lets you composite {ggplot2} plots, {gt} tables, or syntax-highlighted code snippets onto background images, complete with perspective warping, transparency, and decorative panel borders. The idea is to handle design tasks that you'd normally reach for graphic design software for, but reproducibly and entirely within your R workflow. I'll admit I'm not totally sure when I'd use it myself, but if you're after something that looks genuinely unique, it's a fun and creative tool to have in your back pocket. You can chain multiple overlays together or build them up step by step for finer control.
Introducing Posit AI for Positron and RStudio

In this video, the team at Posit introduces Posit AI, their new AI service built into both Positron and RStudio. If you've used Claude Code or a similar tool, the concept will feel familiar: it brings working with LLMs directly into your code editor, so you can get AI assistance without leaving your environment. The video walks through how it works and what it looks like in practice. It's a nice overview if you want to get oriented before trying it yourself.
Map projections: a practical guide to common mistakes and how to fix them
Dominic Royé tackles one of the most common sources of error in scientific maps: choosing the wrong projection. He explains why flattening the Earth always introduces distortion, then walks through the main families of projections (equal-area, conformal, compromise, azimuthal, and equidistant) and when each one is the right choice. The practical R workflows use {sf}, {ggplot2}, and {terra}, showing how to reproject data with st_transform(), apply projections in plots via coord_sf(), and handle rasters with terra::project(). If your maps have ever looked a little off, this is a clear, well-illustrated guide to making them look right.
If you enjoyed this issue of What’s New In R, please share it with a friend! And if they want to get What’s New in R directly in their inbox, they can sign up on the R for the Rest of Us website.
Got any ideas for resources I should feature in future issues of What’s New in R? Leave a comment below!
Sign up for the newsletter
Get blog posts like this delivered straight to your inbox.

You need to be signed-in to comment on this post. Login.