
What’s New in R: July 6, 2026
Welcome to this week's edition of What's New in R! This week, we're featuring a look at generating personalized exams at scale by going straight to Typst, a Quarto extension for shifting heading levels, and a package for building 3D plots with familiar {ggplot2} syntax. Let's dive in!
Personalised Exams at Scale: From Quarto to tynding
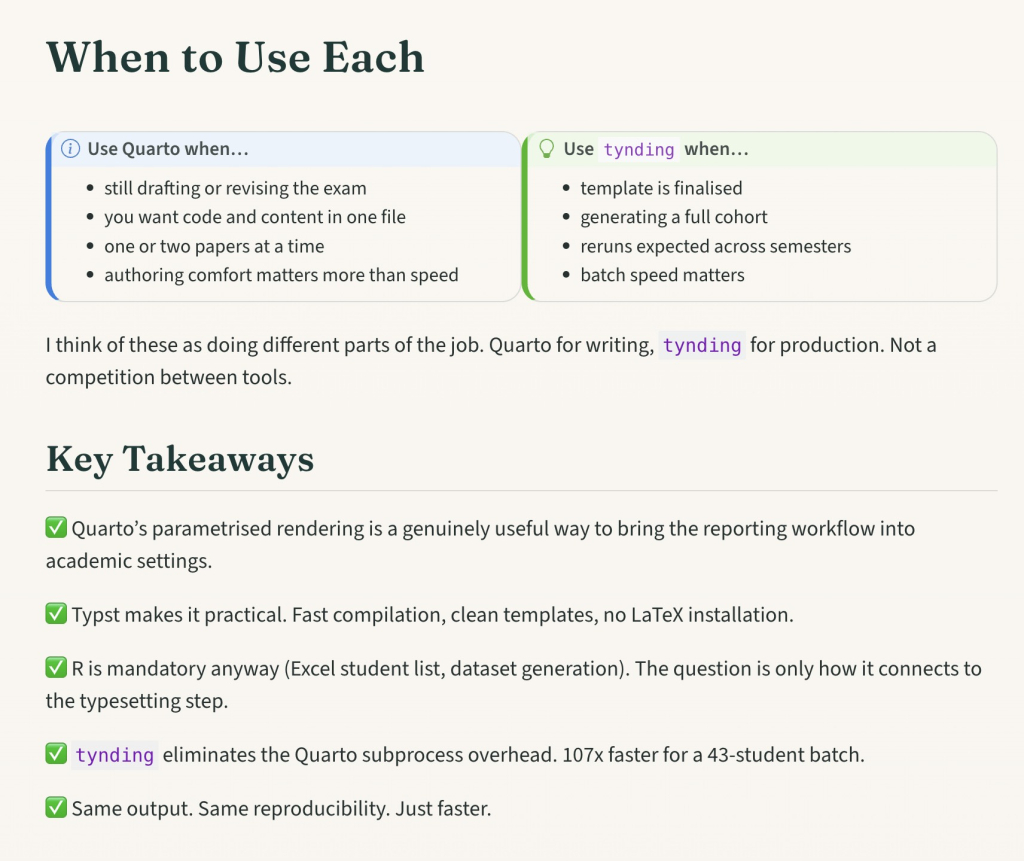
Nithin M walks through how to generate student-specific exam papers, each with randomized questions and unique datasets, and compares two approaches for rendering them all to PDF. The headline is speed: rendering 43 personalized exams through parametrized Quarto documents took about 3.5 minutes, while compiling Typst templates directly with the {tynding} package finished in 2 seconds, roughly 107 times faster. The big win comes from skipping the per-document R subprocess and keeping everything in a single session. I've seen several people in the R community render their images first and then import them into a Typst file for exactly this kind of speed, so if you're interested in going beyond Quarto, this is an interesting read.
Offset Headings
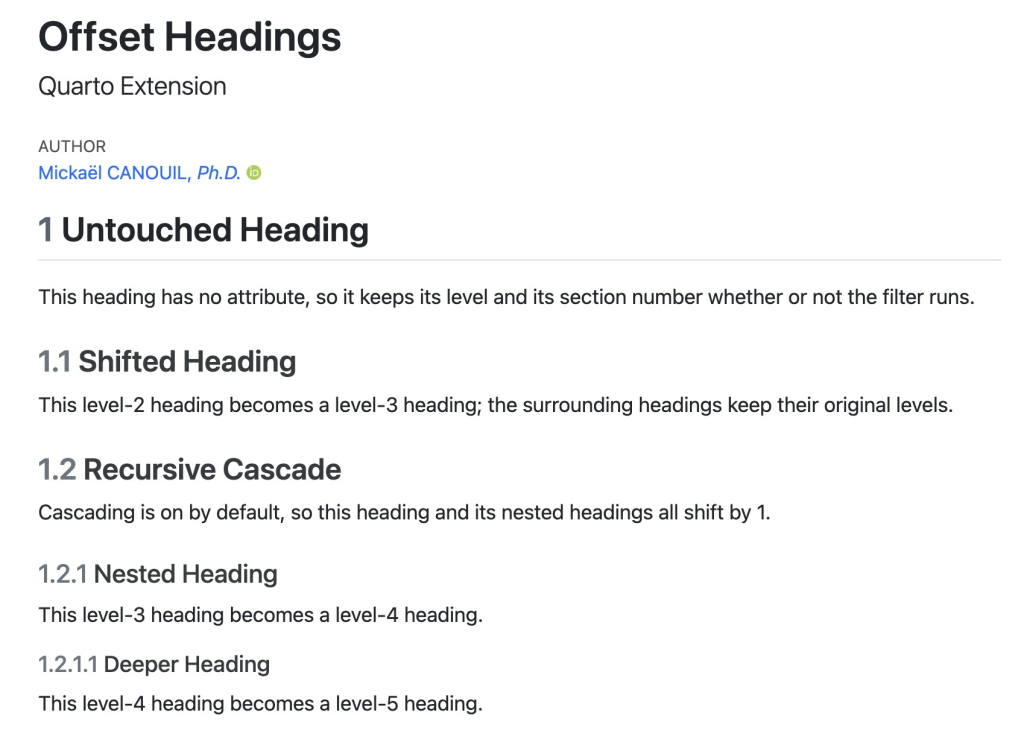
Mickaël Canouil's {quarto-offset-headings} extension lets you shift heading levels up or down by any amount, in any output format. If you've ever wanted an H2 to render as an H1 (or to bump a whole branch of headings down a level), this handles it cleanly during document processing, so other extensions can still work with the adjusted levels. You can apply offsets document-wide, to individual headings, or cascading through descendants, with options to cap the level and limit how deep the cascade goes. Installation is a one-liner with quarto add, plus a filter entry in your YAML.
ggcube
{ggcube}, created by Matthew Kling, extends {ggplot2} to make 3D plots using the syntax you already know, adding a z aesthetic and a coord_3d() coordinate system. It supports a wide range of 3D geometries, including surfaces, scatter plots, paths, text, and prisms, and standard {ggplot2} features like faceting, themes, and scales work as expected. A word of caution: as the package itself notes, 3D plots are great for exploration and data art but tricky for precise quantitative communication, thanks to occlusion and perspective distortion. Still, if you've been wanting to make 3D figures in R, this is one nice way to do it.
If you enjoyed this issue of What’s New In R, please share it with a friend! And if they want to get What’s New in R directly in their inbox, they can sign up on the R for the Rest of Us website.
Got any ideas for resources I should feature in future issues of What’s New in R? Leave a comment below!
Sign up for the newsletter
Get blog posts like this delivered straight to your inbox.



You need to be signed-in to comment on this post. Login.