I "only" use R for descriptive stats – and that's OK
I have a confession: the only statistics I do in R are descriptive statistics. I have only very occasionally used R for t tests, chi square, linear regression, or other inferential stats. Why, you might be wondering, would I use software designed by and for statisticians, data scientists, and other folks on the quantitative end of the spectrum if I'm using it for the types of analyses most people do in Excel? A complete answer to this question requires some background.
The daily R-bloggers email gives great examples of how people use R. I get a ton of value out of it. But many of the posts that it shares are on topics that are way, way beyond my quantitative skills (what is a random forest exactly?). Although the R community is incredibly welcoming, it is dominated by data scientists and other folks with extensive quantitative backgrounds. There is, of course, nothing wrong this, but it can be intimidating for newbies, especially those, like me, who are not hardcore quants. This fear that "R is not for people like me" may lead many to never take up R in the first place.
But here a couple points to consider:
This explains why tidyverse packages like dplyr and tidyr are consistently among the most downloaded R packages. These packages are so popular because they provide the simplest and most efficient way to import, clean, reshape, and analyze data. Need proof of how amazing these packages are? Watch this live coding by DataCamp chief data scientist David Robinson.
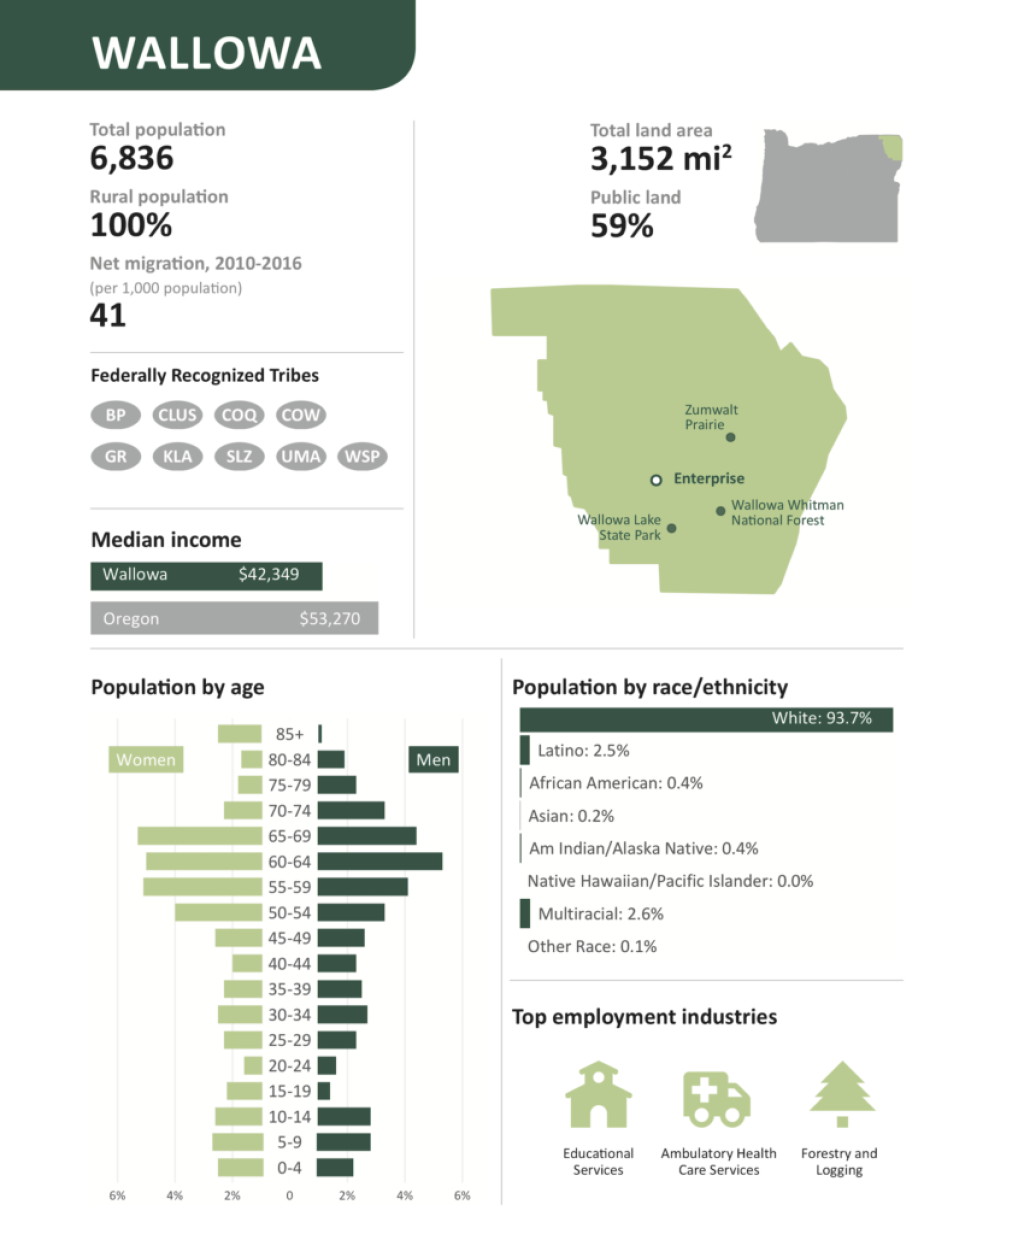
I use the dplyr and tidyr packages for nearly every R project I work on, and we teach them as part of our workshops, online courses, and custom trainings. These packages, combined with ggplot2 for data visualization are how I produce data visualizations like those in the recent Oregon by the Numbers report.
One of the best things about the R community is the fact that Jesse Mostipak and other users bravely share their struggles to learn R, normalizing the idea that we're not all experts.
Vulnerable but important tweets for data scientists & programmers:
— Jesse Mostipak 🦦 (@kierisi) November 30, 2018
🤷IDK: I don't know
🧠TIL: today I learned
😬 Mistakes I've made
Normalizing the fact that no one knows it all (not even you!), everyone makes mistakes, and learning is a lifelong process has profound impacts.
My version of imposter syndrome is worrying that I don't have the quantitative skills to be considered a "real" R user. But I've learned that this concern is largely in my own head. When I recently shared about the many ways that I use R that I never even thought about before taking it up, it resonated with many people.
When I made the switch from using Excel to R I thought I was just doing a like-for-like replacement for my analysis and dataviz work. What I found was that R actually made so much more possible than I ever imagined. A short thread. #rstats
— David Keyes (@dgkeyes) October 1, 2018
Coming to terms with the fact that I don’t do hardcore quantitative work in R has allowed me to focus on the reasons I do use it: to produce high-quality data visualization that helps organizations increase their social impact (and, of course, to teach others to use R).
There are many reasons to learn R, which I won’t spell out here (though do check out this recent Quartz article by Dan Kopf). There are also some good reasons not to learn R (it has a well-earned reputation for being difficult to pick up so definitely consider whether the time it takes to learn is worth it), as noted in this illustration by Allison Horts.
Thanks to anyone who shares their past + current fears/anxiety about anything R-related. It reminds me that being afraid of/overwhelmed by learning new #rstats (which I am, often!) is (a) OK, (b) common, and (c) no indication of how successful I'll be at it...eventually 😊. pic.twitter.com/PSR7AArgW3
— Allison Horst (@allison_horst) December 2, 2018
Fear that you do not have the quantitative skills to use R, however, should not dissuade you from learning it. As R has grown, the range of things that it can do is expanding. Millions of people use R every day to do work as diverse as making beautiful maps, accessing Census data directly, and analyzing qualitative data.
So learn from me and don't be afraid to learn R because you are not a hardcore quant. You can (and should!) use R even if you "only" do descriptive stats.
Sign up for the newsletter
Get blog posts like this delivered straight to your inbox.

You need to be signed-in to comment on this post. Login.