Skip to content
What's New in R is a weekly email to help you up your R game. Sign up →
R for the Rest of Us Logo

Tables are often boring, hard to read, and, most importantly, they don't communicate effectively. In this course, Albert Rapp will show you that creating beautiful tables is just a matter of learning some important principles. You'll learn these principles and how to apply them using the flextable package. And when you're done making your beautiful tables, you'll learn to export them to any format you need. If you're ready to make tables that look great and communicate well, this is the course for you!

In this course, you'll go from tables that look like this:
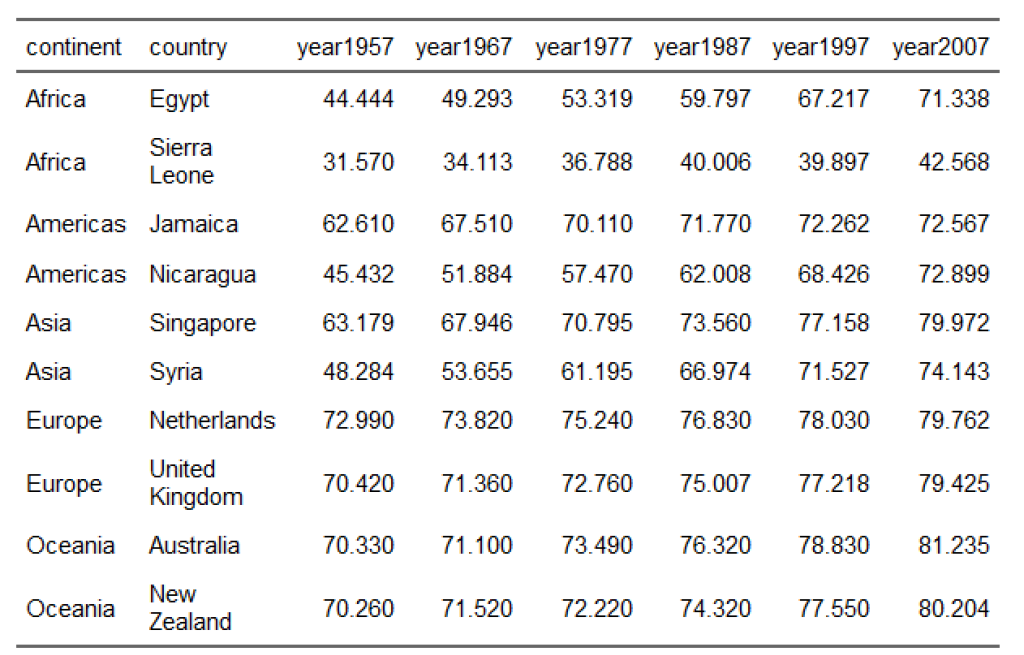
A boring, sad table.

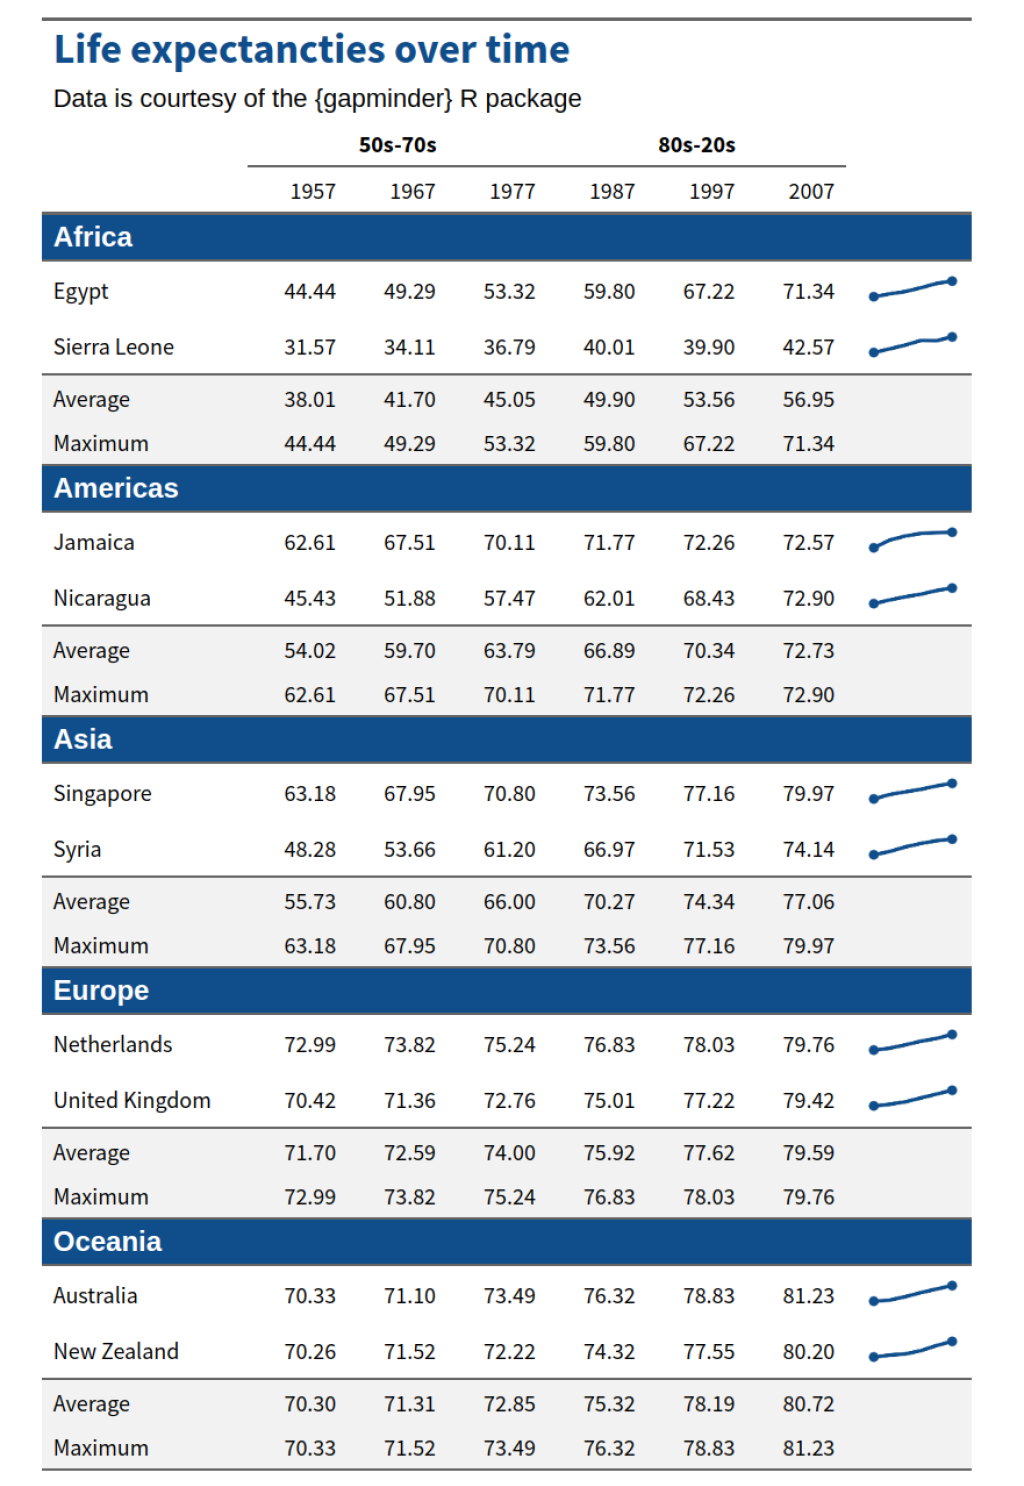
To tables that look like this:

Want to see more of what Making Beautiful Tables with R has to offer? Check out the sample lessons on formatting numbers in tables and exporting tables.
Making Beautiful Tables with R

16 Lessons (2h 53m) • 56 Students Enrolled

Albert Rapp By Albert Rapp

Course Includes

  • Certificate
  • Self-Paced
  • Lifetime Access

50% discount for:

Students
Low-income locations

25% discount for:

Groups of 3 or more

Bundle Discounts

Buy multiple courses at the same time for a discount.

2 Courses

20% off

3 Courses

25% off

4 Courses

30% off

5+ Courses

35% off

Cannot be combined with any other discount.

Course Content

16 Lessons (2h 53m)

Albert Rapp

Albert Rapp

About the Instructor

Albert is a math PhD student, freelancing consultant and content creator. He's fascinated by the blend of data analytics, web development, and visualization, and loves sharing his knowledge with everyone on Twitter, LinkedIn, and YouTube.

What People Say

Making tables in R has been greatly improved thanks to the gt() and flextable() packages. In particular, I found gt() to be extremely user-friendly. However, gt() has a major caveat: it does not make it easy to export tables into Word and PowerPoint. In this course, Dr. Rapp clearly shows how to use flextable() to achieve the same quality as gt() when rendering tables. He also explains how to easily export the tables into other formats, such as PowerPoint. His lecture on adding graphs to a flextable() is exceptional. In addition to learning flextable(), I also learned how to clean data using regex, nesting, and mapping data, as well as creating functions. Dr. Rapp’s imagination in this regard is unparalleled.

Alberto F Cabrera
Alberto F Cabrera Professor Emeritus, University of Maryland

Get Lifetime Access

for $99