Making Beautiful Tables with R
Use better column names and a title
This lesson is called Use better column names and a title, part of the Making Beautiful Tables with R course. This lesson is called Use better column names and a title, part of the Making Beautiful Tables with R course.
Transcript
Click on the transcript to go to that point in the video. Please note that transcripts are auto generated and may contain minor inaccuracies.
Loading transcript...
Next up, we need to use better column names. That’s because flextable() prints a data frame as is. Consequently, column names may not really be human readable at all. For example, column names may contain underscores or some other kind of unusual notation.
While we’re at it, we should avoid duplicating a lot of column names. For example, in this example, we see that we always repeat the species name. To avoid that it’s best to add a novel row of so-called spanners. Furthermore, we should add one more important label, i.e. a title.
flextable(penguin_counts_wider) |>
  set_header_labels(
    island = 'Island',
    year = 'Year',
    Adelie_female = 'Female',
    Adelie_male = 'Male',
    Chinstrap_female = 'Female',
    Chinstrap_male = 'Male',
    Gentoo_female = 'Female',
    Gentoo_male = 'Male'
  ) |>
  add_header_row(
    values = c('', 'Adelie', 'Chinstrap', 'Gentoo'),
    colwidths = c(2, 2, 2, 2)
  ) |>
  add_header_lines(
    values = c('Penguins in the Palmer Archipelago', 'Data is courtesy of the {palmerpenguins} R package')
  ) |>
autofit()Alternative:
new_names <- c('Island', 'Year', rep(c('Female', 'Male'), 3))
names(new_names) <- colnames(penguin_counts_wider)

flextable(penguin_counts_wider) |>
  set_header_labels(
    values = new_names
  ) |>
  add_header_row(
    values = c('', 'Adelie', 'Chinstrap', 'Gentoo'),
    colwidths = c(2, 2, 2, 2)
  ) |>
  add_header_lines(
    values = c('Penguins in the Palmer Archipelago', 'Data is courtesy of the {palmerpenguins} R package')
  ) |>
autofit()Your Turn
Take your previous table, and
set column labels,
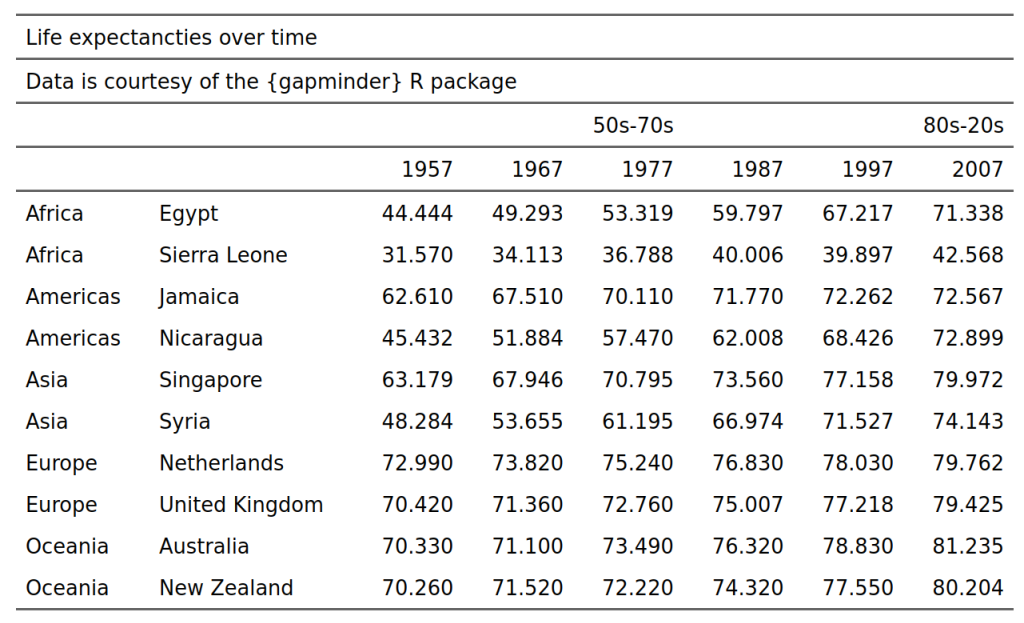
add a new label to group 50s-70s and 80s-20s,
add a line for a title and subtitle each and
then apply
autofit()
You can set the column labels either by hand or using a named vector.
After the exercise, your table should look like this:
Course Content
16 Lessons