Making Beautiful Tables with R
Change the text appearance
This lesson is called Change the text appearance, part of the Making Beautiful Tables with R course. This lesson is called Change the text appearance, part of the Making Beautiful Tables with R course.
Transcript
Click on the transcript to go to that point in the video. Please note that transcripts are auto generated and may contain minor inaccuracies.
Loading transcript...
In this lesson we use bold(), color(), style() and fp_text() functions from {officer} package.
bind_rows(penguin_counts_wider, maximum_summary, total_summary) |>
  arrange(island, year) |>
  mutate(island = paste('Island: ', island)) |>
  as_grouped_data(groups = 'island') |>
  as_flextable(hide_grouplabel = TRUE) |>
  set_header_labels(
    island = 'Island',
    year = '',
    Adelie_female = 'Female',
    Adelie_male = 'Male',
    Chinstrap_female = 'Female',
    Chinstrap_male = 'Male',
    Gentoo_female = 'Female',
    Gentoo_male = 'Male'
  ) |>
  add_header_row(
    values = c('', 'Adelie', 'Chinstrap', 'Gentoo'),
    colwidths = c(1, 2, 2, 2)
  ) |>
  add_header_lines(
    values = c('Penguins in the Palmer Archipelago', 'Data is courtesy of the {palmerpenguins} R package')
  ) |>
  align(i = 3, align = 'center', part = 'header') |>
  colformat_num(i = ~ (is.na(island)), na_str = '-') |>
  align(
    i = ~ (year %in% 2007:2009),
    j = 'year',
    align = 'right'
  ) |>
  hline(i = ~ (!is.na(island) | year %in% c('2009', 'Total'))) |>
  bg(i = 3:4, bg = 'dodgerblue4', part = 'header') |>
  bg(i = ~ (year %in% seq(2007, 2009, 2)), bg = 'grey90') |>
  bold(part = 'header', i = 3) |>
  color(i = 3:4, part = 'header', color = 'white') |>
  style( #### subtitle
    part = 'header',
    i = 2,
    pr_t = fp_text(font.size = 10),
  ) |>
  style( ### title
    part = 'header',
    i = 1,
    pr_t = fp_text(
      color = 'dodgerblue4',
      font.size = 18,
      font.family = 'Merriweather',
      bold = TRUE
    )
  ) |>
  style( ### group rows
    i = ~ (!is.na(island)),
    pr_t = fp_text(
      color = 'dodgerblue4',
      bold = TRUE,
      font.size = 12,
    )
  ) |>
autofit()Your Turn
Adjust selected text properties:
Change the font family to “Source Sans Pro” everywhere (you can also use some other font that you like. If you don’t have the font installed yet, you can find it online. Just unzip the file and install the
.otf-file)Make the title bigger (size 18), bold and change its color to
"dodgerblue4"Set the subtitle to font size 11
Make the group labels (“50s-70s”) bold
Make the continent labels white and bold
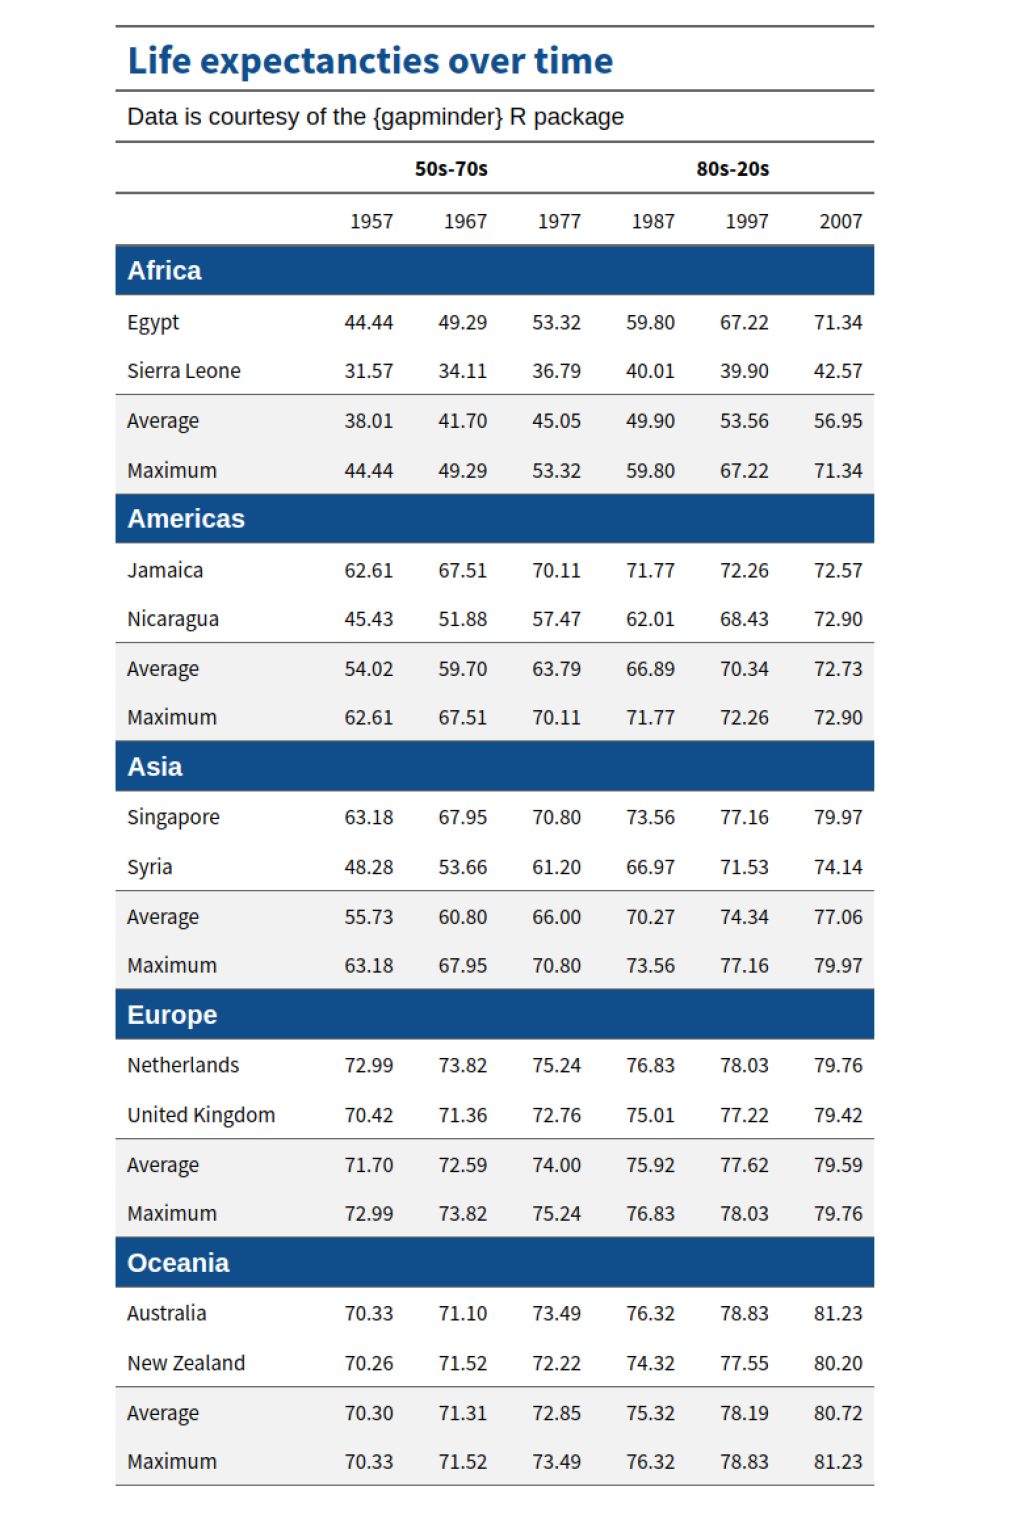
Your table should look like this:
Course Content
16 Lessons