
Making Beautiful Tables with R
Format your table's numbers
This lesson is called Format your table's numbers, part of the Making Beautiful Tables with R course. This lesson is called Format your table's numbers, part of the Making Beautiful Tables with R course.
Transcript
Click on the transcript to go to that point in the video. Please note that transcripts are auto generated and may contain minor inaccuracies.
Loading transcript...
Notice that our table contains a lot of missing numbers. That’s fine but leaving a lot of white space may be off putting to the reader. So, let’s add small dashes to the empty cells.
This demonstrates how to format missing numbers, but it also explains how format any kind of data. Also, this will introduce formulas for selecting specific cells in the table.
penguin_counts_wider |>
  mutate(island = paste('Island: ', island)) |>
  as_grouped_data(
    groups = 'island'
  ) |>
  as_flextable(hide_grouplabel = TRUE) |>
  set_header_labels(
    island = 'Island',
    year = '',
    Adelie_female = 'Female',
    Adelie_male = 'Male',
    Chinstrap_female = 'Female',
    Chinstrap_male = 'Male',
    Gentoo_female = 'Female',
    Gentoo_male = 'Male'
  ) |>
  add_header_row(
    values = c('', 'Adelie', 'Chinstrap', 'Gentoo'),
    colwidths = c(1, 2, 2, 2)
  ) |>
  add_header_lines(
    values = 'Penguins in the Palmer Archipelago\nData is courtesy of the {palmerpenguins} R package'
  ) |>
  align(i = 2, align = 'center', part = 'header') |>
  colformat_num(i = ~ (is.na(island)), na_str = '-') |>
autofit()Your Turn
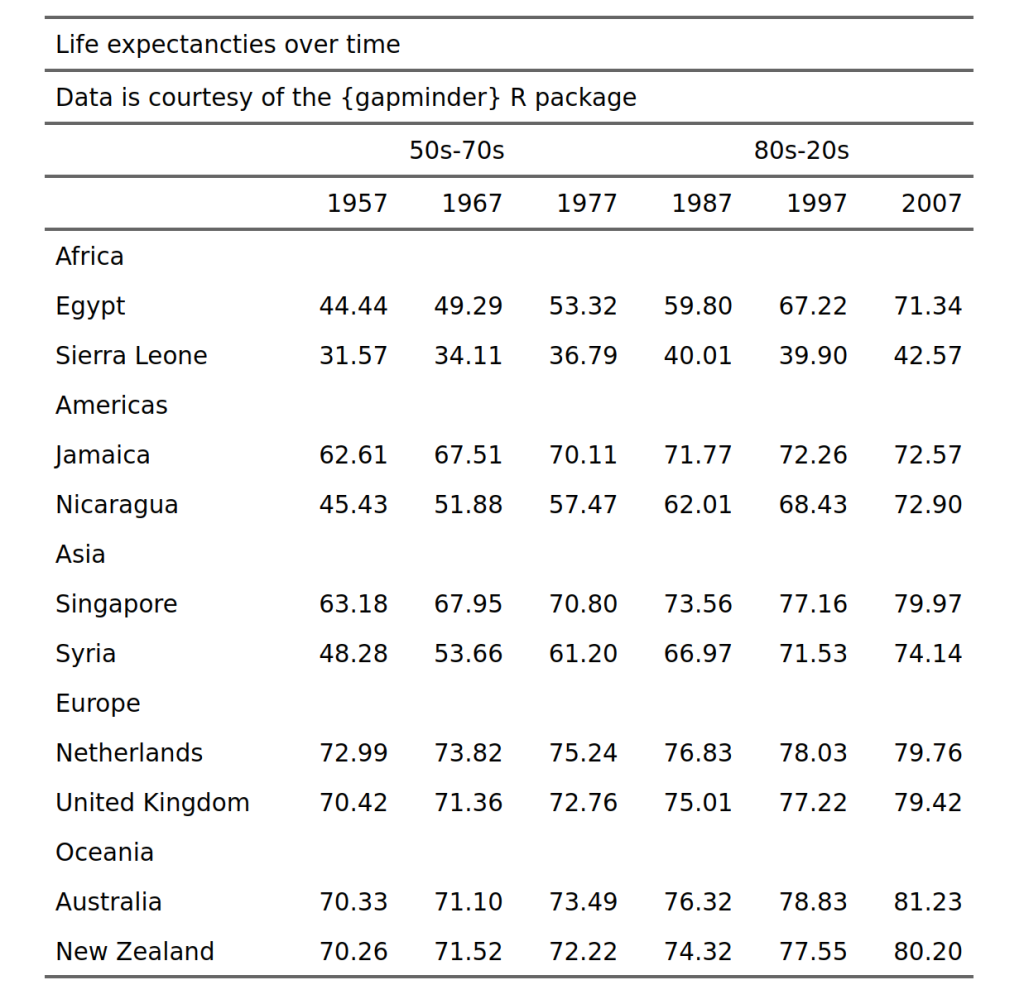
Round the numbers to two decimals with colformat_double(). Your table should look like this:
Course Content
16 Lessons