Reproducibility for the Rest of Us
When I first heard that one of the benefits of using R was reproducibility, I was confused. As a PhD anthropologist who has worked for the last several years in the world of program evaluation, I assumed reproducibility meant scientists in labs being able to rerun other scientists' studies in order to check that they hadn't made up their results. Reproducibility seemed interesting, but entirely irrelevant to me.
Boy, was I wrong. Reproducibility means something far broader than I previously realized. After using R for a while, I finally came to appreciate that the user who most often needs to reproduce my work is me. Reproducibility isn't just about a robust peer review process; it's about not having to do the same thing over and over.
The user who most often needs to reproduce my work is me.
Here's an example. As part of my data visualization consulting work, I was recently making some maps for the Ford Family Foundation. These maps showed where the Ford Institute for Community Building has done work over the last few years. I made a map several months ago with data the Foundation provided to me.
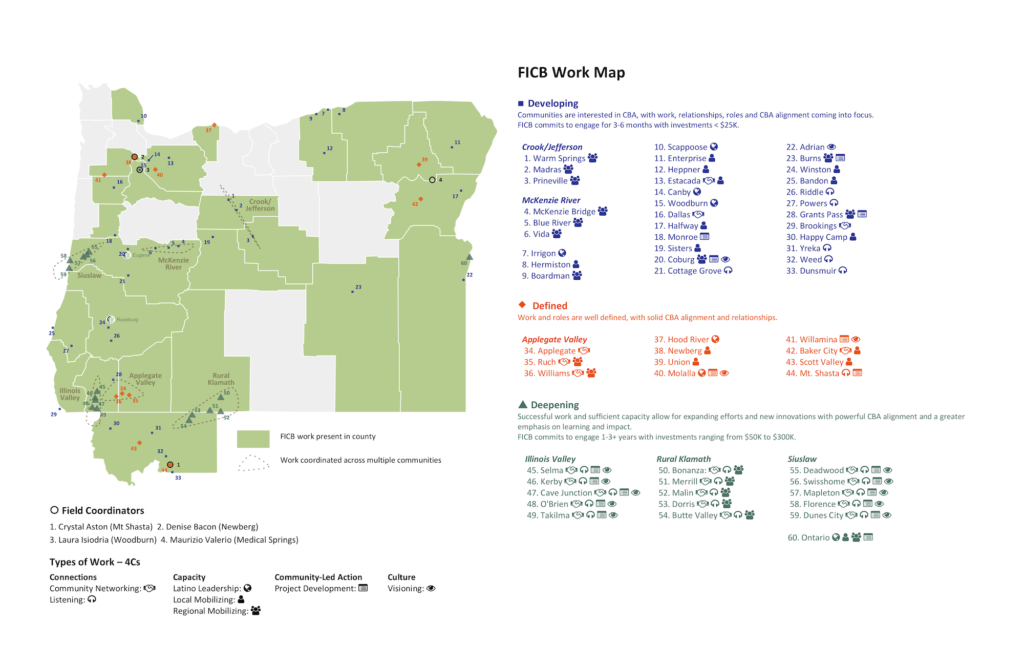
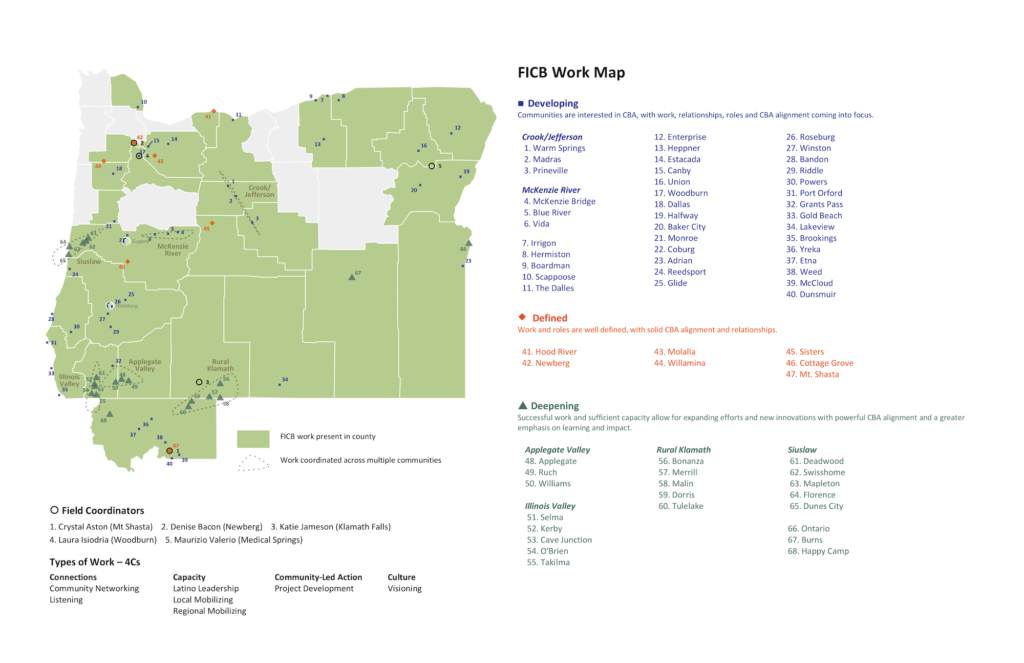
Last week, staff from the Foundation came back to me. They had started work in some new communities and ended work in others. Instead of having to go back and recreate this map, I could simply rerun the code I had previously created and voila, a new map. (There are some other changes I made, removing icons and more, but focus on the updated locations on the map!)
Reproducibility can be what I always assumed it was (and much more — see this comprehensive post from the rOpenSci Project on reproducible research). For many users, though, this traditional notion of reproducibility is far less of a reason to take up R than is the idea that you can save time by rerunning existing code with updated data.
Updated with Video
Want to see the code?
Interested in seeing the code used to make this map? You can find it on GitHub. Note that I created the map itself in R, then did the overall layout in Word. The map is in the plots folder, the laid out version in the final folder.
Sign up for the newsletter
Get blog posts like this delivered straight to your inbox.

You need to be signed-in to comment on this post. Login.