My R Journey: David Keyes
Hi there, I'm David, the one man behind this one-man operation. I've started a series of posts asking others to tell me about their R journeys. It didn't seem fair, though, to not do the same myself. So, here's the story of how I came to learn R, how I use it today, and why I think it's worth learning.
Why did you decide to learn R?
I'm a PhD social scientist, but I never used R in grad school. Two reasons: 1) I'm an anthropologist and my training was mostly qualitative. 2) The one mixed-methods project I worked on in grad school (the Mexican Migration Field Research Program) had a statistician who I relied on for all of my quantitative analyses.
After I left academia, I went into evaluation. I spent two years on the research team at the Oregon Community Foundation. Most of our work there was done in Excel. I did take an R workshop at the 2015 American Evaluation Association conference, but, with no one else on my team using R, I never continued with it.
In 2016, I left OCF and started doing evaluation consulting. The clients I was working with didn't care how I did my work, they just wanted high-quality analysis and data visualization. I had always harbored a not-so-secret hatred of Excel and so I decided this was the time to learn R.
How easy or difficult was learning R? What resources were most helpful?
I found it quite difficult overall. One of the benefits of R is that there are always multiple ways to do things. But this is super confusing when you're learning! How do you know what the easiest way to do something is?
The fact that there are so many ways to do anything in R is both a blessing and curse for newbies.
I remember a period of several months where I would do some reading or tutorials about R and then try to work on a project. I think there were at least five projects that I started in R, got to a point where I couldn't do something, and had to go back to Excel. It was super frustrating!
The moment things clicked for me was when I learned about the Tidyverse. The emphasis on human-readable code was so important in making things click for me. Gone were the days of struggling with brackets, nested parentheses, and the like. The pipe in particular made so much conceptual sense to me.
I don't remember all of the resources I used, but I definitely tried swirl and read R for Data Science. R for Data Science has since become an amazing resource for me, but I think I started it too early in my learning process. I think there was a lot of basic knowledge about how R works that I didn't get when I read it. Don't get me wrong: it's an incredible resource, but only at the right point in someone's learning.
In what ways has learning R changed your work?
In so many ways! From a workflow perspective, I'm so much more efficient than I used to be. Working in RMarkdown and then knitting to Word (Microsoft, stop following me!) is such a better workflow than doing analysis and visualization in Excel, writing in Word, and then combining the two.
Learning R has also opened up new work possibilities for me. I only rarely do straight evaluation work anymore. Instead, I've developed a niche in data visualization. I now work with evaluators and other researchers to help them improve how they communicate their work. I've been able to develop this niche because I learned R. Not only has it improved my overall data visualization skills, but it's also enabled me to do new types of visualizations I could never do in Excel. For example, maps. I make so many maps now and I love it. The development of the sf and ggplot2 packages with regard to mapping make it so easy!
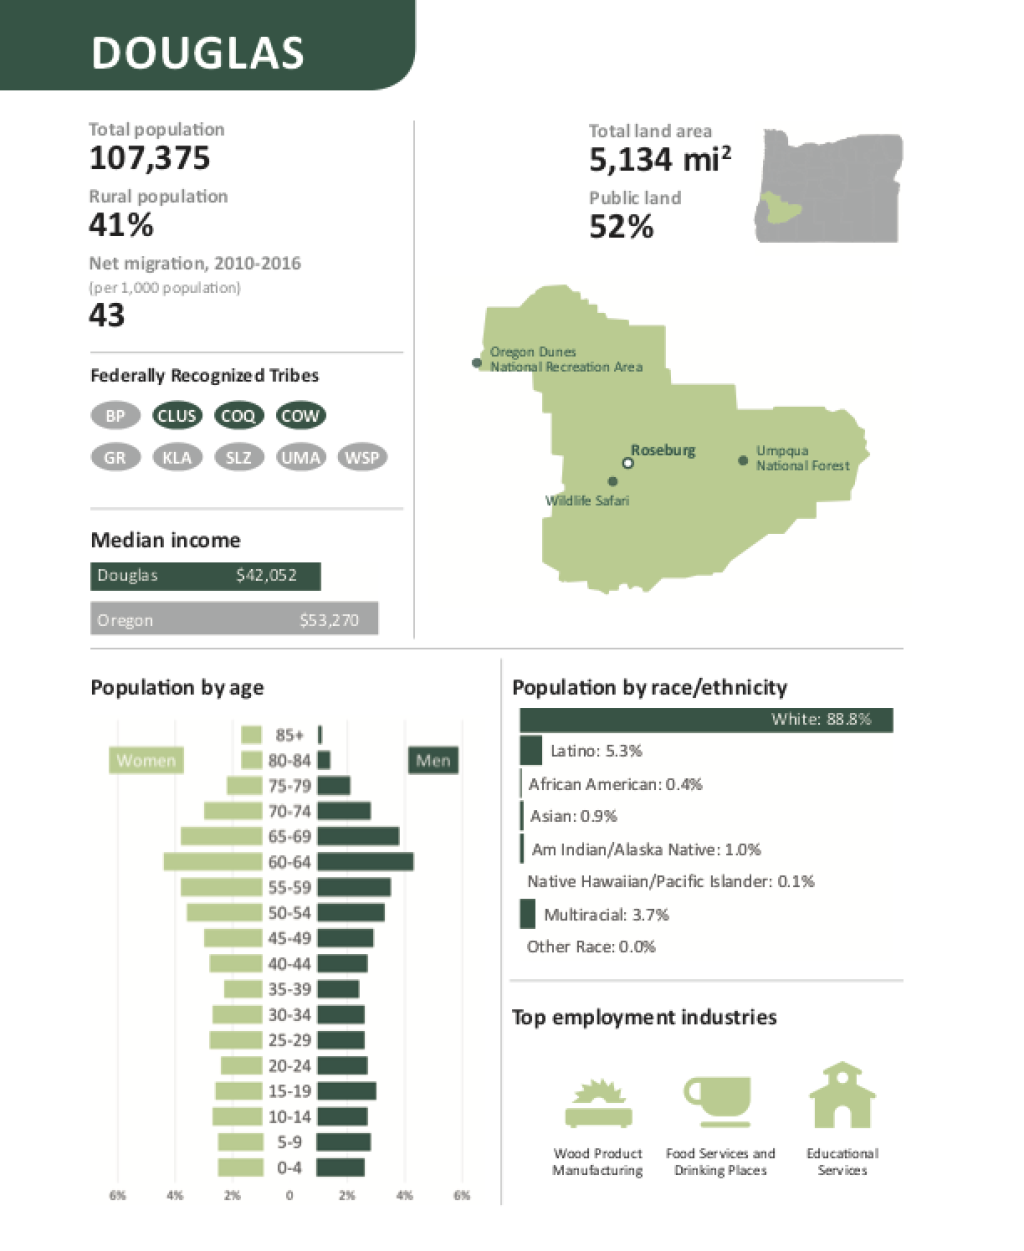
The work I'm most proud of is called Oregon by the Numbers. It's a report done for the Ford Family Foundation on key social and economic indicators in each of Oregon's 36 counties. Working together with the Foundation, we came up with great graphics to make the report compelling to readers. This is the kind of report that would often consist of tables that would lead readers' eyes to glaze over, but, using ggplot we made it a report that people actually read and get value from!
What do you think people considering learning R might not appreciate about it?
The number one thing is RMarkdown, without a doubt. It took me a long time to get RMarkdown. For a while, I was using R to do analysis and make visualizations. Then, I'd take the resulting tables or figures and put them into Word. Once I realized that I didn't need to do this, it changed everything! People so often see R as a direct replacement for Excel, SPSS, SAS, Stata or whatever tool they're using. RMarkdown is the best example of R is more than a simple replacement for these tools.
The other thing I'd say is that, being open-source, the dynamism around R is amazing. The pace of package development is astounding. I can't tell you how many times I've wondered if R can do something, spent 30 seconds Googling, and found a package that does exactly what I need. The time you save by relying on the work of others and not having to reinvent the wheel each time you want to do something new (to you) is amazing.
I can't tell you how many times I've wondered if R can do something, spent 30 seconds Googling, and found a package that does exactly what I need.
I'll finish by saying that the R community is incredible. I've written about how grateful I, as a straight white male, am for the women and others who have made it such a welcoming environment. Being able to go ask questions on Twitter or in the R for Data Science Slack community and get thoughtful, helpful responses is amazing. As someone who learned at age 35, I worried I'd be surrounded by young whippersnappers (I turn 40 in December, I'm allowed to say whippersnappers) who would laugh at an old like me who just didn't get it. My experience has been the exact opposite. Having such a welcoming community to ask questions to is nice, of course, but also makes learn R so much easier!
Sign up for the newsletter
Get blog posts like this delivered straight to your inbox.

You need to be signed-in to comment on this post. Login.