2021 Year in Review
As 2021 comes to a close, I wanted to share what R for the Rest of Us has been up to this year. It's been a busy year and just trying to remember everything we did has been a challenge!
You'll notice first of all that I said we. I've always used I when referring to the business because, before 2021, it was pretty much just me running R for the Rest of Us. In the beginning of the year, I decided it was time to bring on others to help me. Throughout the year, I've worked with others on courses, trainings, and consulting projects. You'll see their names sprinkled below.
Courses
R in 3 Months
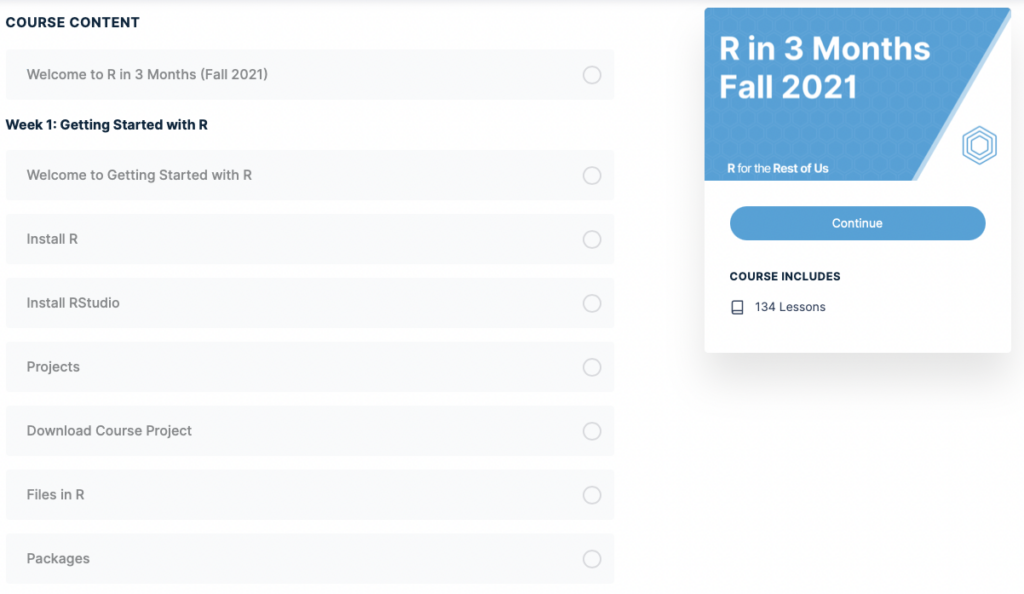
The biggest new thing in 2021 was R in 3 Months. This program came out of my desire to answer the question: how long does it take to learn R?
We ran two cohorts of R in 3 Months this year, with over 100 people total taking part. Participants completed course materials on a set schedule, met for weekly live sessions, and worked on their own projects with extensive feedback from Charlie Hadley (my collaborator on R in 3 Months) and me.
R in 3 Months is the program that I could have used when I was learning R. There are so many approaches to using R and it's hard to know which way to go. Helping people learn R without the thousands of missteps I made is what Charlie and I hoped to achieve. And based on this feedback from Hannah Kroenker, Technical Director at Tropical Health, I think it has succeeded:
Thank you for all the help! I feel like searching the internet for help with R is like looking for a very specific needle across a giant field of haystacks, and you both are the metal detectors that get us where we need to be more quickly.
Data Cleaning with R
There was also a new course released in 2021: Data Cleaning with R. Made by Luis Darcy Verde Arregoitia, it's a great overview of how to do that thing we all have to do but few people talk about. It's helped me to finally learn some regular expressions.
Training
While in-person training did not happen in 2021, R for the Rest of Us conducted multiple virtual trainings.
Washington Area Metro Transit Authority (WMATA)
I conducted a training for data analysts at Washington DC-based WMATA (i.e. the people who run the trains and buses in the nation's capital and vicinity).
Cardea Services
A long-postponed (it was supposed to be in-person back when that was a thing) training for Cardea Services brought together staff from Washington, California, and Idaho. In addition to the initial training, I've provided project support for the Cardea team, helping them deal with problems as they come up in their work.
Michigan Fitness Foundation
I've worked with the evaluation team at the Michigan Fitness Foundation for over a year now. They began by taking several R for the Rest of Us courses. We followed this with biweekly calls to answer questions, present new topics, etc. A year ago, they were only starting to use R. Now, they're producing automated websites that constantly update with new data. It's been amazing to watch their progress!
Consulting
Before 2021, I did almost all of the consulting projects myself. As more work has come in, that's become impossible. Almost of the projects were done with collaborators. And the end result is much better for it!
Below is a sampling of some of the projects R for the Rest of Us worked on in 2021.
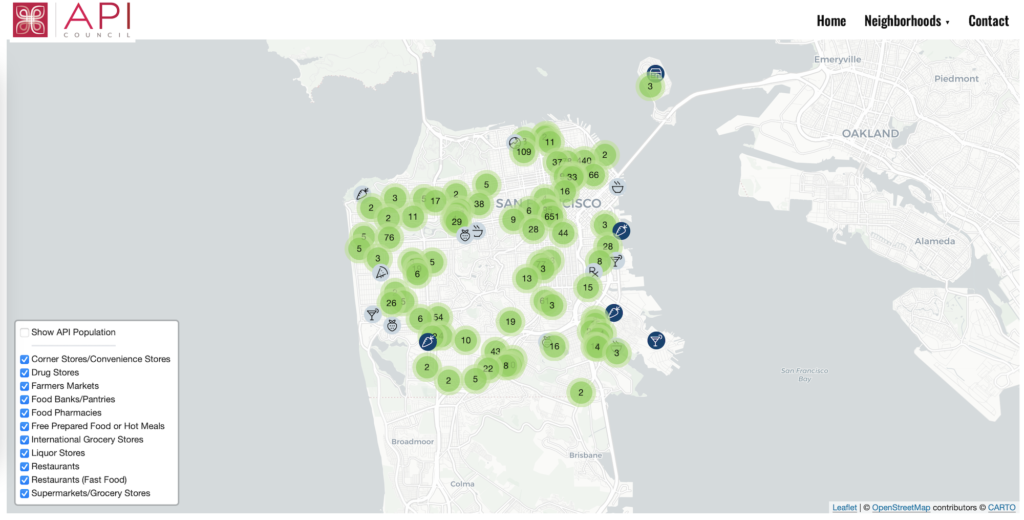
Asian Pacific Islander Council Food Map
Working with Katie Jolly and Ellen Graham, R for the Rest of Us partnered with Intention2Impact and the Asian Pacific Islander (API) Council to create an interactive map of food resources in San Francisco.
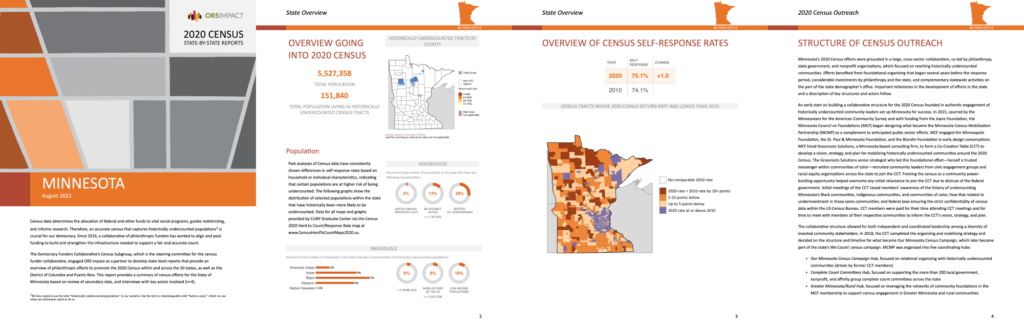
Census Outreach Reports
Together with Thomas Vroylandt and Charlie Hadley, we worked with ORS Impact to produce reports on outreach efforts during the 2020 Census. The 52 reports show what was done in each state to ensure all people were counted as part of the Census.
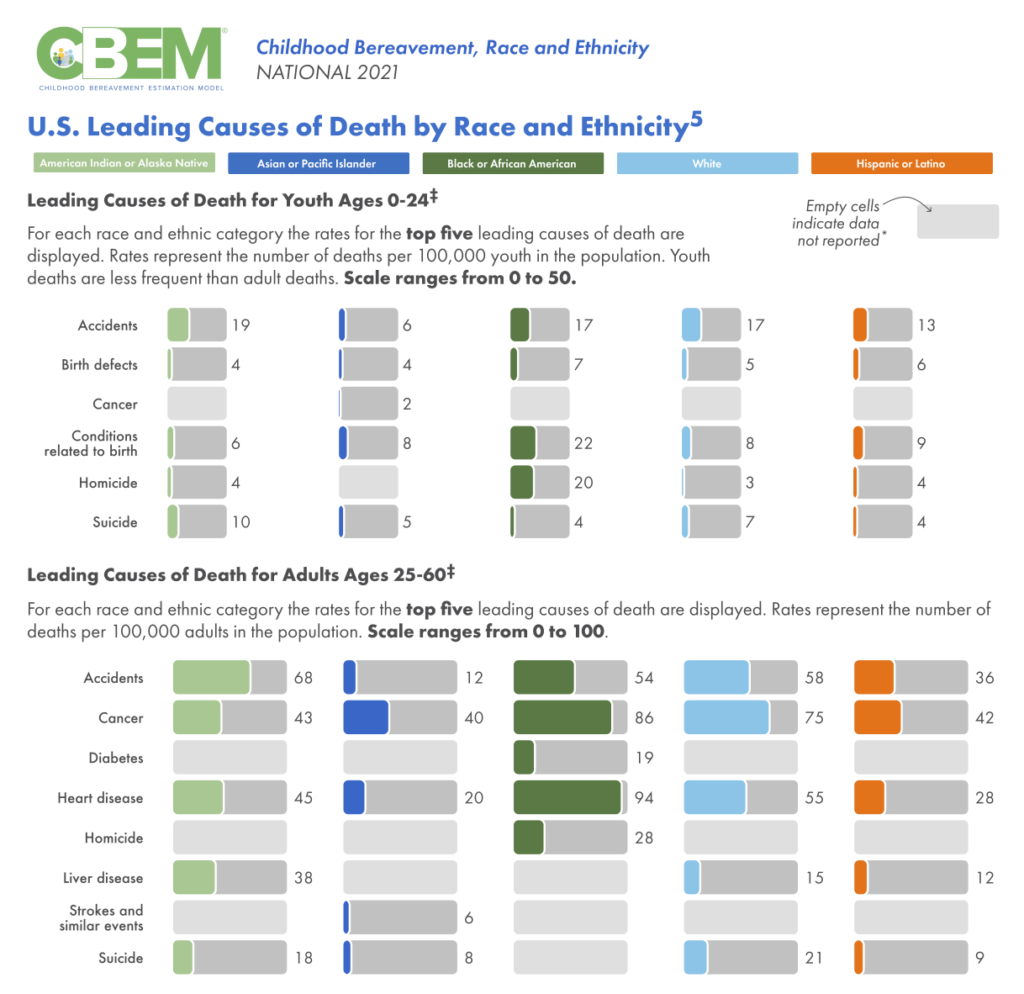
Childhood Bereavement Estimation Model Reports
Judi's House
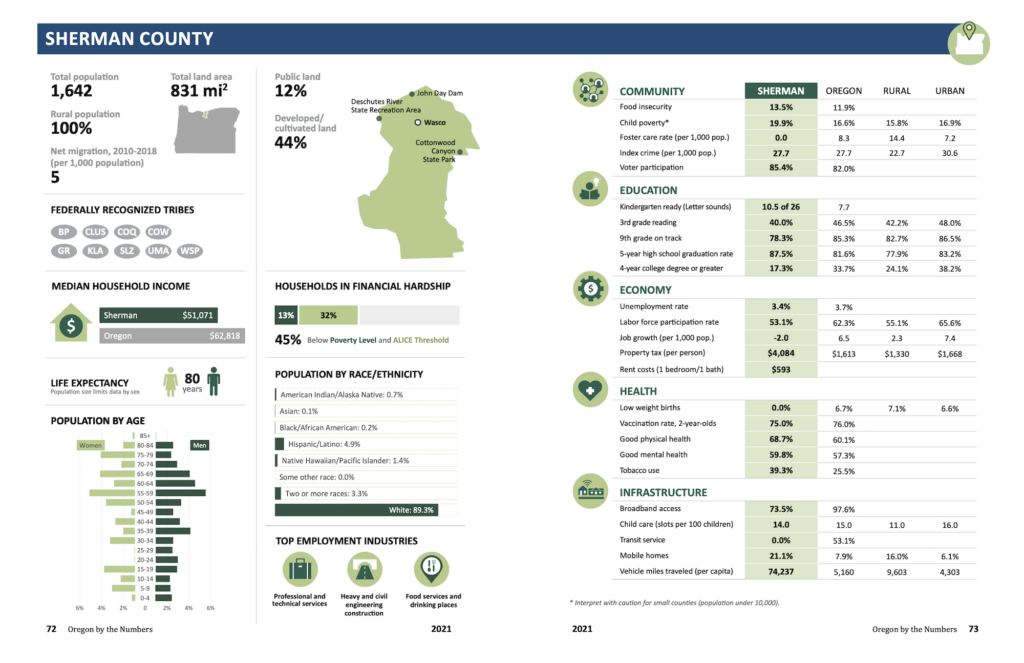
Oregon by the Numbers
I've worked on the data viz for Oregon by the Numbers since it was first released four years ago. The 2021 edition came out this year and it looks great, as always. The best part about it was how quick it is now to produce it: I can update the visuals in just a few hours each year using R code I've produced in previous years.
What does 2022 have in store?
2021 has been a busy year, as you can see. I've got some big plans for R for the Rest of Us in 2022. More on that soon!
In the meantime, check out the R for the Rest of Us offerings: courses, custom trainings, and consulting work to help you on your R journey.
Sign up for the newsletter
Get blog posts like this delivered straight to your inbox.

You need to be signed-in to comment on this post. Login.