How to tidy select all that apply questions in R
Surveys often have multiple choice, select all that apply questions. Being able to wrangle this type of data in R can be challenging. Figuring out the right way to get your data into the (tidy) structure necessary for visualizing it with ggplot can be complicated. And, to make things even more complicated, different survey tools spit out data from select all that apply questions in different formats.
This blogpost is going to demonstrate how we would use tidy data principles and the tidyverse to wrangle data from a variety of different survey tools. The data was initially gathered by me tweeting a link to the exact same survey in Google Forms, Qualtrics and Survey Monkey.
I'm writing a blogpost on tidying multiple choice survey questions with {tidyr}.
— @[email protected] (@charliejhadley) April 28, 2022
Could you help by completing these <1min surveys?https://t.co/n4o50idCCqhttps://t.co/ouqi3k7EZLhttps://t.co/UtsRxsJ8HR pic.twitter.com/Y6FzT37CUH
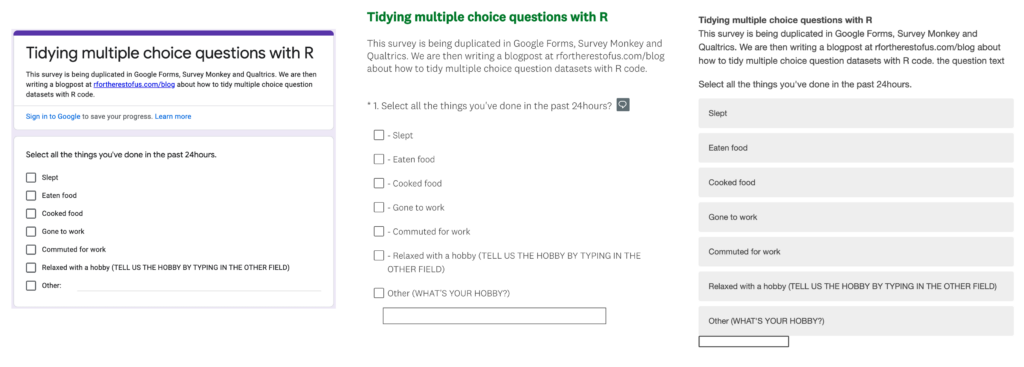
The survey contained just one question that looks like this:
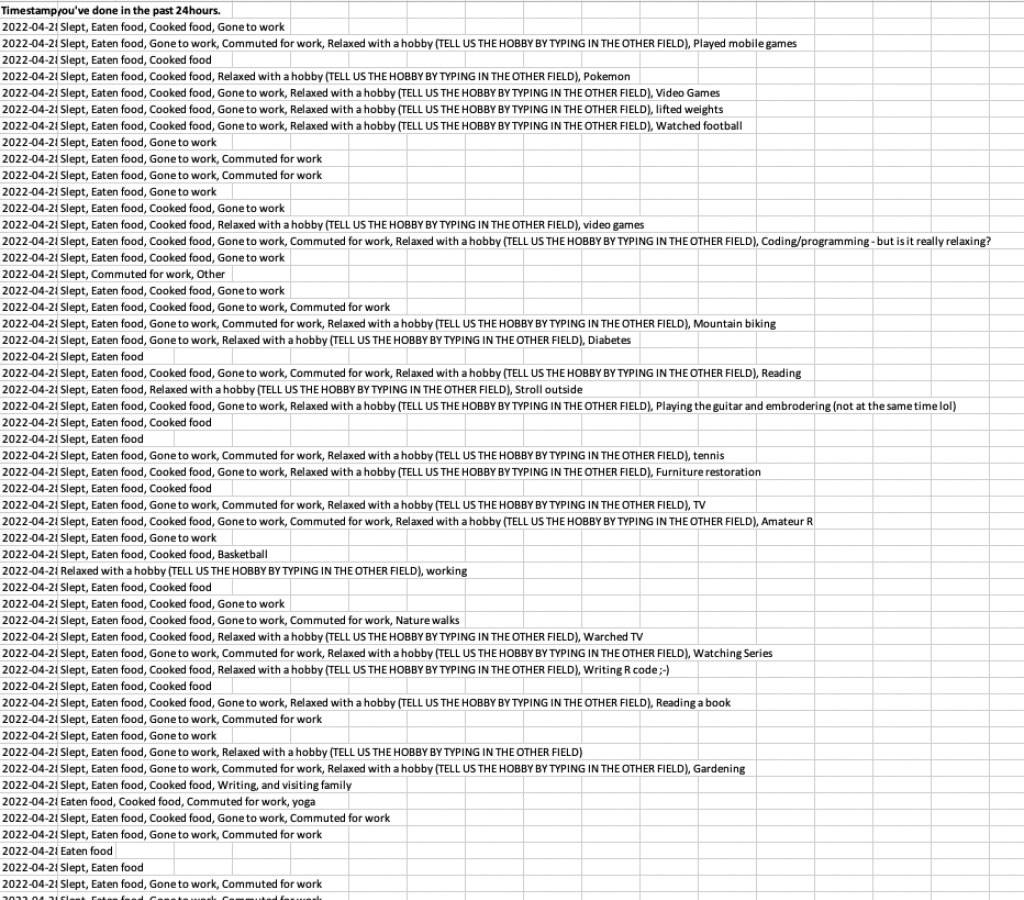
The data that came out looks different for each tool.
Google Forms has the data in a single column, with responses separated by commas.
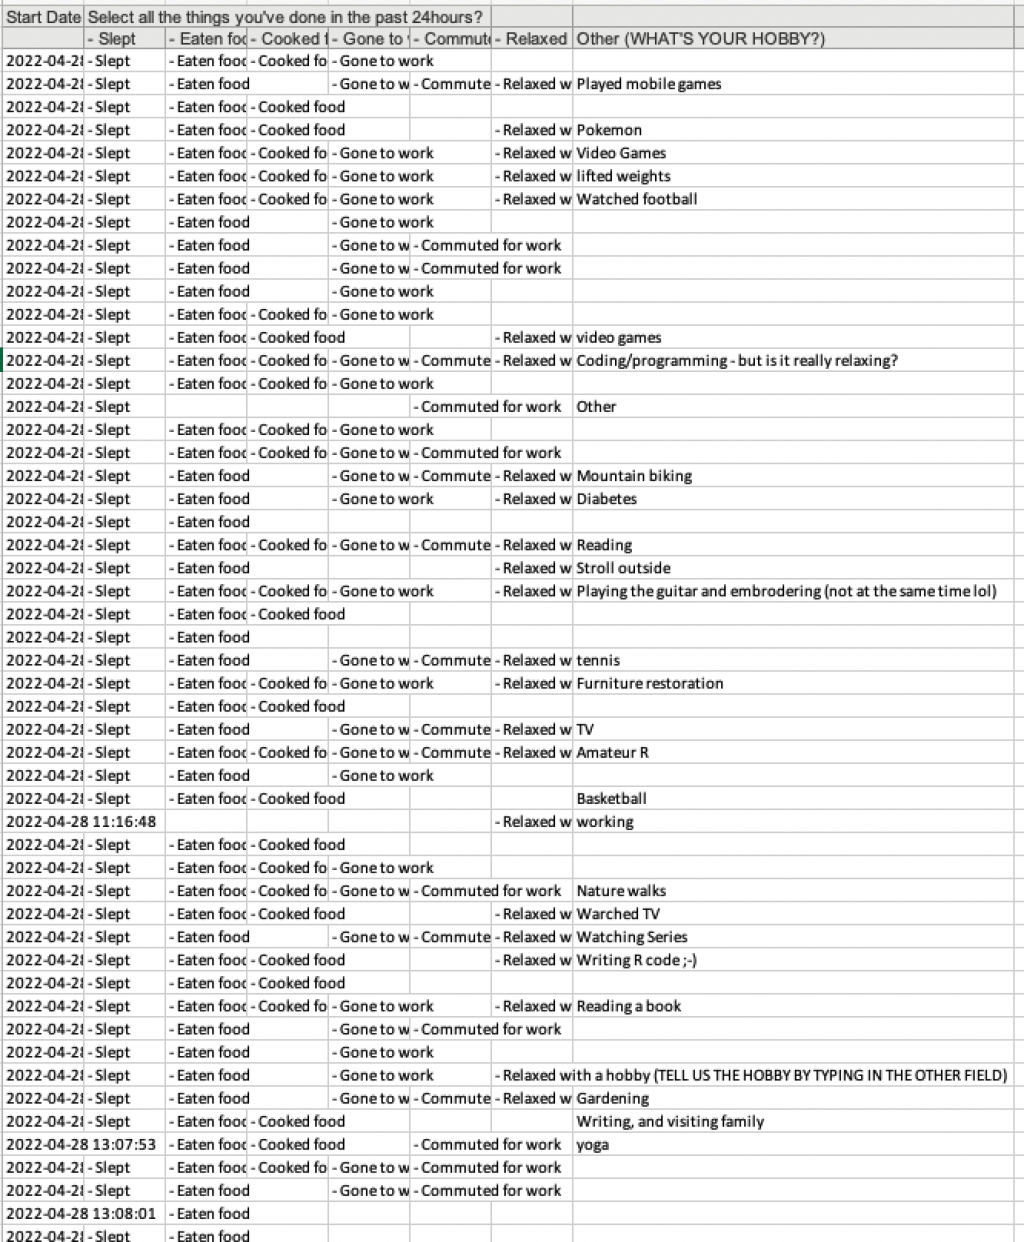
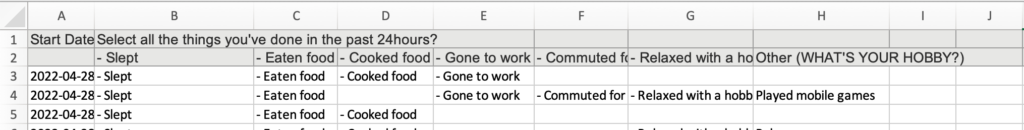
Survey Monkey creates one column for each potential response (and an additional column for "other responses).
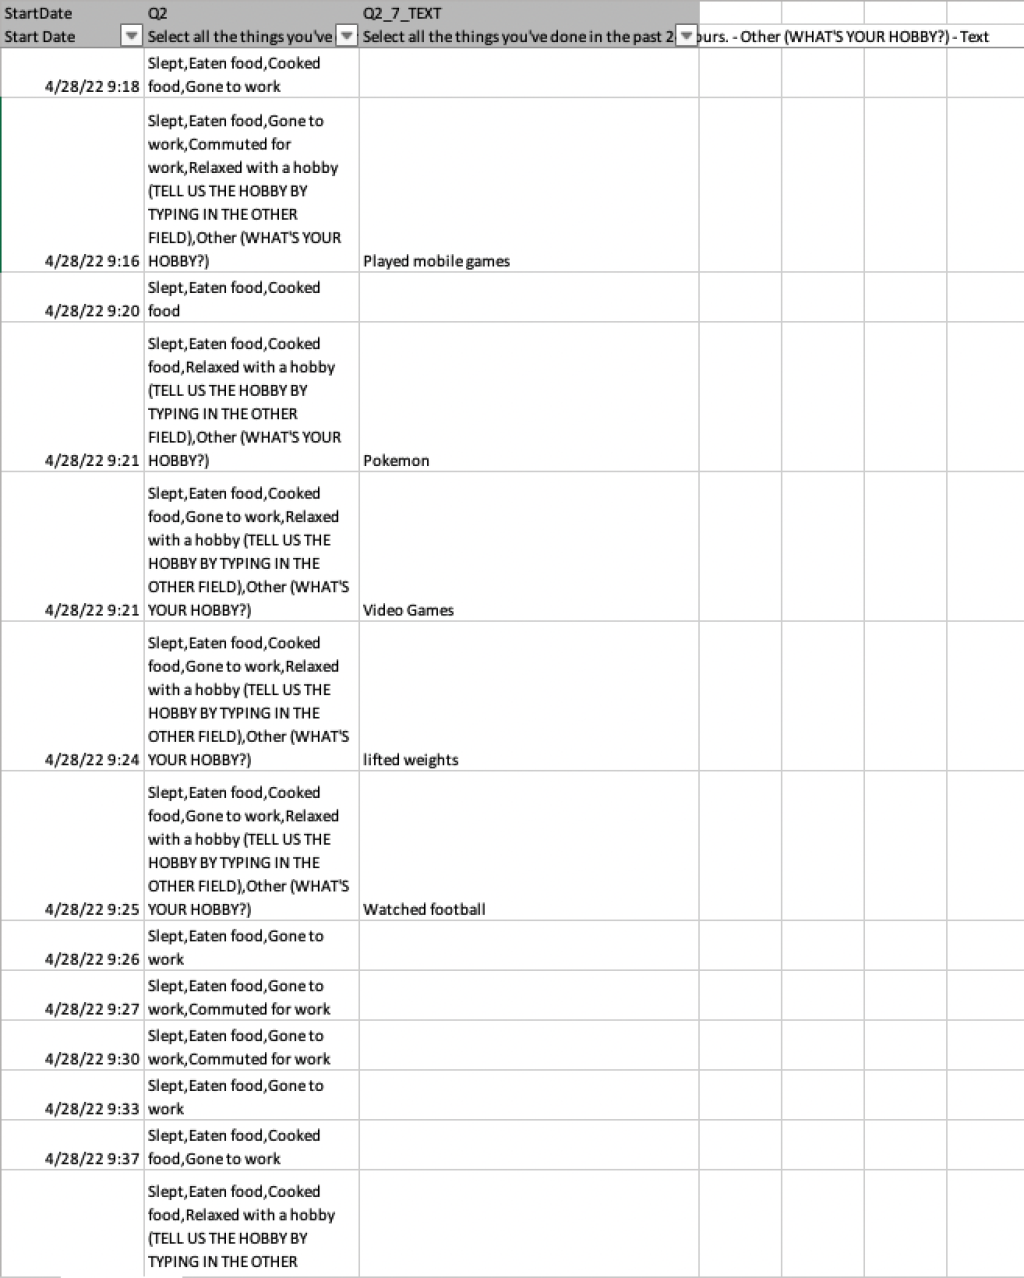
Qualtrics creates one column for all responses in the select all that apply list of options and a separate column for "other" responses.
No matter how the data comes in, we ultimately want it in a tidy format like this:
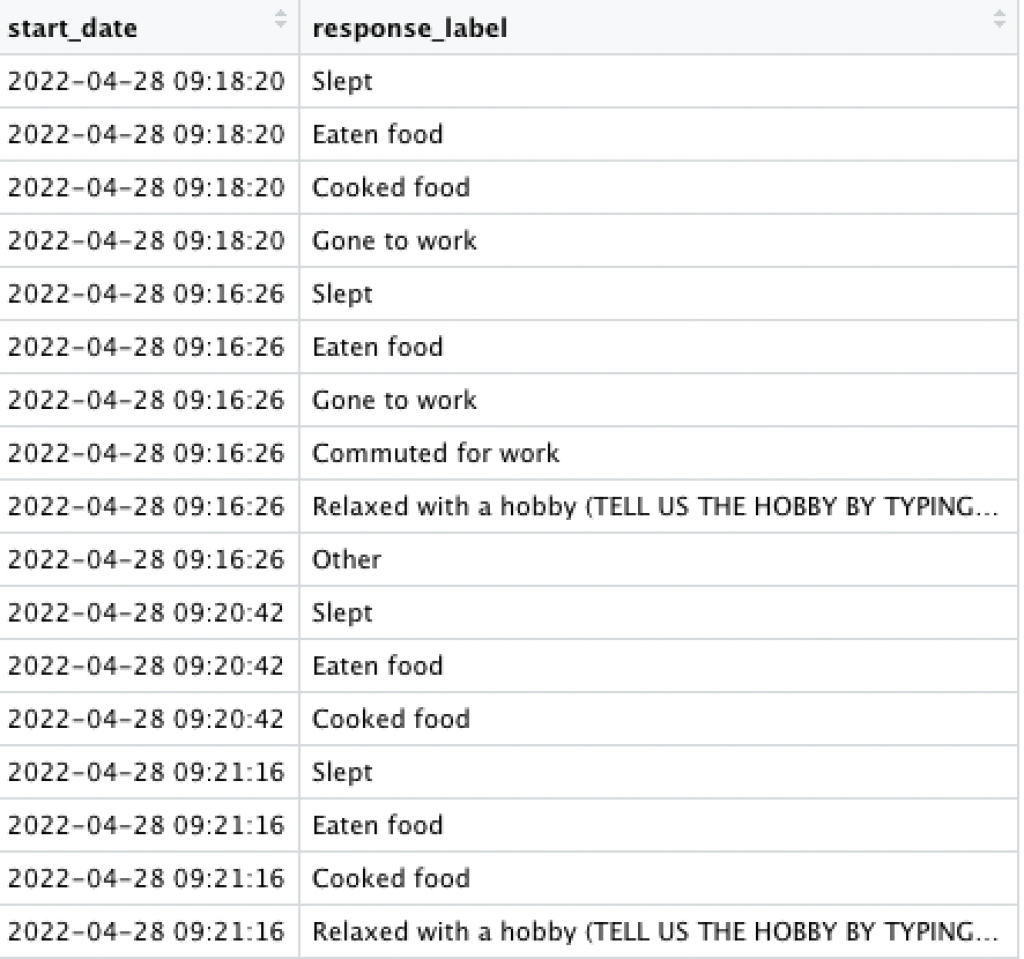
Note that each response is on its own row, following the tidy data principles:
Every column is a variable.
Every row is an observation.
Every cell is a single value.
How do we get our data into this format? Let's dive in!
Google Forms
Google Forms is the survey tool we usually choose as the forms look good and we can read the responses into R via the excellent {googlesheets4} package. To make things simpler, you can download the results as an Excel file.
It's actually fairly pleasant to work with Google Forms survey data, as I demonstrate in this video. I've also provided a tidied up version of the code below.
library(tidyverse)
library(readxl)
library(janitor)

google_forms_raw <- read_excel("data/google-forms-data.xlsx") %>%
  clean_names()

fixed_responses <- c("Slept", "Eaten food", "Cooked food", "Gone to work", "Commuted for work", "Relaxed with a hobby (TELL US THE HOBBY BY TYPING IN THE OTHER FIELD)")

google_forms_tidy <- google_forms_raw %>%
  separate_rows(select_all_the_things_youve_done_in_the_past_24hours,
                sep = ", ") %>%
  mutate(things_done_in_last_24hours = case_when(
    select_all_the_things_youve_done_in_the_past_24hours %in% fixed_responses ~ select_all_the_things_youve_done_in_the_past_24hours,
    TRUE ~ "Other"
  ))

google_forms_tidy %>%
  count(things_done_in_last_24hours) %>%
  ggplot(aes(x = n,
             y = things_done_in_last_24hours)) +
geom_col()Survey Monkey
Survey Monkey no longer has a free tier that allows you to download data from the service. There is an experimental package {surveymonkey} for directly downloading data from your account, but I haven't experimented with it.
The export format of Survey Monkey splits headers across multiple rows, which the {readxl} package on its own isn't designed to deal with. However, the awesome {unheadr} package allows us to mash together column names across multiple rows.
As I show in the video, once we've used {unheadr} to tidy up the columns the next step is to convert the data from wide to long with pivot_longer().
library(tidyverse)
library(readxl)
library(janitor)
library(unheadr)

survey_monkey_raw <- read_excel("data/survey-monkey-data.xlsx") %>%
  mash_colnames(1) %>%
  clean_names()

fixed_responses <- c("Slept", "Eaten food", "Cooked food", "Gone to work", "Commuted for work", "Relaxed with a hobby (TELL US THE HOBBY BY TYPING IN THE OTHER FIELD)")

survey_monkey_long <- survey_monkey_raw %>%
  pivot_longer(select_all_the_things_youve_done_in_the_past_24hours_slept:last_col()) %>%
  mutate(value = str_remove(value, "- "))

survey_monkey_tidy <- survey_monkey_long %>%
  mutate(response_label = case_when(
    value %in% fixed_responses ~ value,
    is.na(value) ~ NA_character_,
    TRUE ~ "Other"
  )) %>%
  select(start_date, response_label) %>%
  drop_na(response_label)

survey_monkey_tidy %>%
  count(response_label) %>%
  ggplot(aes(x = n,
             y = response_label)) +
geom_col()Qualtrics
There is a great package called {qualtRics} for programmatically downloading survey data from Qualtrics. Unfortunately, you do have to have a paid Qualtrics account.
I actually really appreciate the data format that Qualtrics uses, each question has two columns: one for the fixed responses and the other column contains write in values. As I demonstrate in the video below we can use separate_rows() to convert observations into a long, tidy dataset.
library(tidyverse)
library(readxl)
library(janitor)
library(unheadr)

qualtrics_data_raw <- read_excel("data/qualtrics-data.xlsx",
           skip = 1) %>%
  clean_names()

qualtrics_tidy <- qualtrics_data_raw %>%
  separate_rows(select_all_the_things_youve_done_in_the_past_24hours_selected_choice,
                sep = ",")

qualtrics_tidy %>%
  count(select_all_the_things_youve_done_in_the_past_24hours_selected_choice) %>%
  ggplot(aes(x = n,
             y = select_all_the_things_youve_done_in_the_past_24hours_selected_choice)) +
geom_col()Sign up for the newsletter
Get blog posts like this delivered straight to your inbox.

You need to be signed-in to comment on this post. Login.
Beth Duckles • June 3, 2022
Hi Charlie! The link to "download the results as an excel file" under Google Forms doesn't work!