Animated versions of common dplyr functions
One of the best parts about the functions in the dplyr package (one of several that make up the tidyverse collection of packages) is that their names indicate what they do. No need to remember a weird acronym; the name of the function to filter your data is filter(). But, helpful as these function names are, it can still be hard to remember exactly what the functions do. In remaking my Fundamentals of R course in 2023, I had Albert Rapp generate animated versions of the most common functions.
In addition to the video below, which shows short snippets from multiple lessons in the Fundamentals of R course, I've posted animated GIFs of the various dplyr functions. All of the animations use data from the palmerpenguins package. I hope these might be helpful if you are learning R!
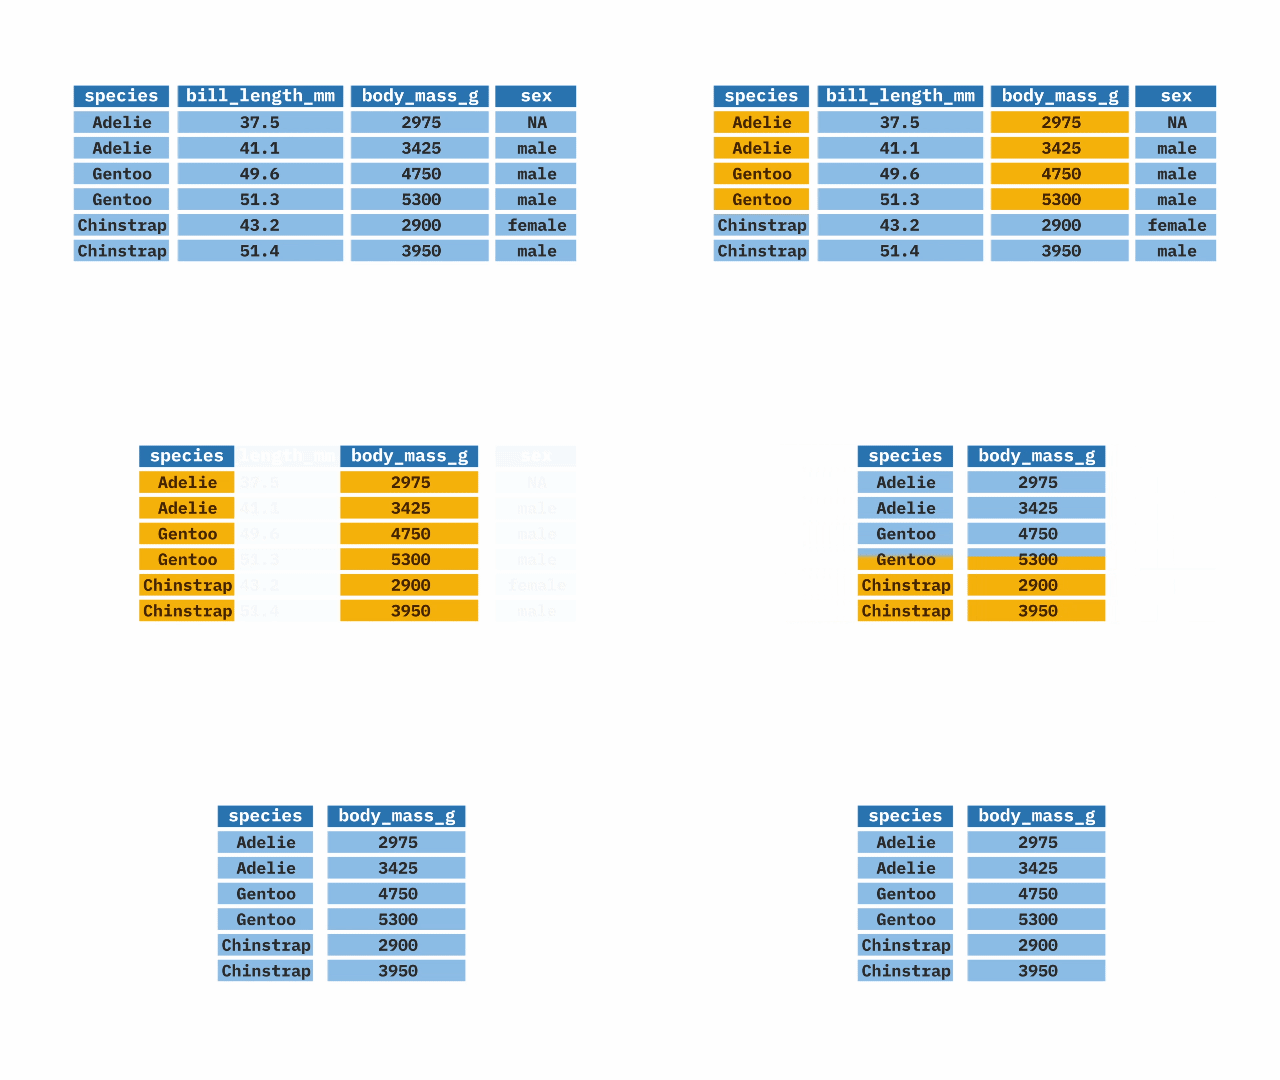
select()
The select() function from the dplyr package in R allows selection or exclusion of specific columns (variables) within large datasets. It is particularly useful when working with large datasets and only certain columns are needed.
Animation
Sample Code
library(tidyverse)
library(palmerpenguins)

penguins |>
select(species, body_mass_g)mutate()
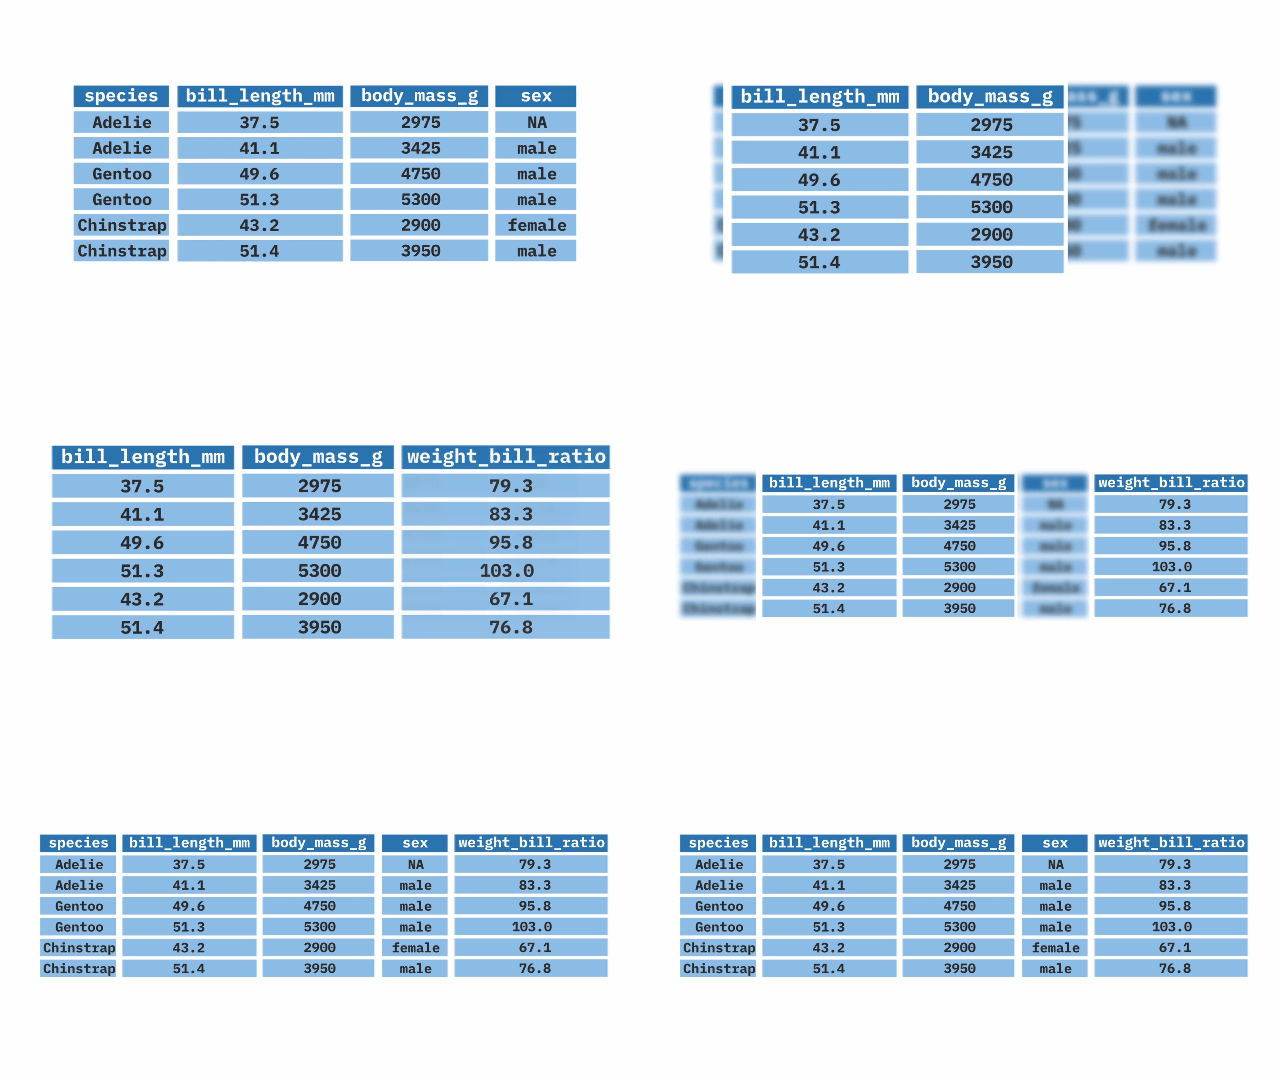
The mutate() function from the dplyr package in R allows us to create new variables or modify existing ones. It can assign a specific value to a new variable, create a new variable based on the values of other variables, or change the values of existing variables by utilizing mathematical expressions.
Animation
Sample Code
library(tidyverse)
library(palmerpenguins)

penguins |>
mutate(weight_bill_ratio = body_mass_g / bill_length_mm)filter()
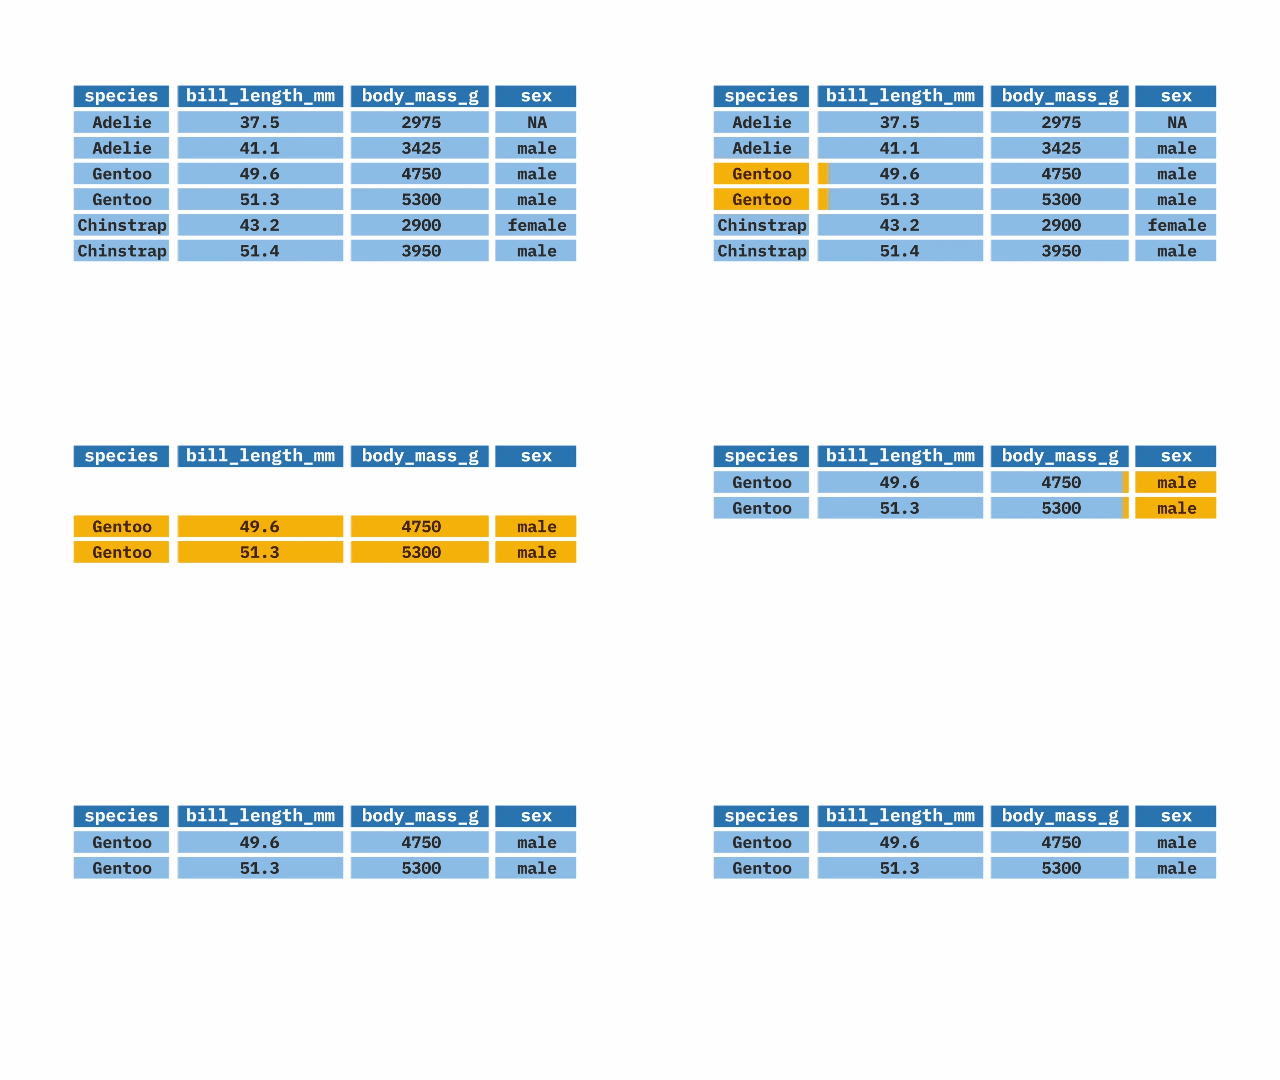
The filter() function from the dplyr package in R is used when we want to keep or exclude specific rows from a large dataset (recall that select() does the same thing for columns). It takes a variable from the data frame and applies a condition to it, keeping the rows that meet the condition.
Animation
Sample Code
library(tidyverse)
library(palmerpenguins)

penguins |>
filter(species == "Gentoo")summarize()
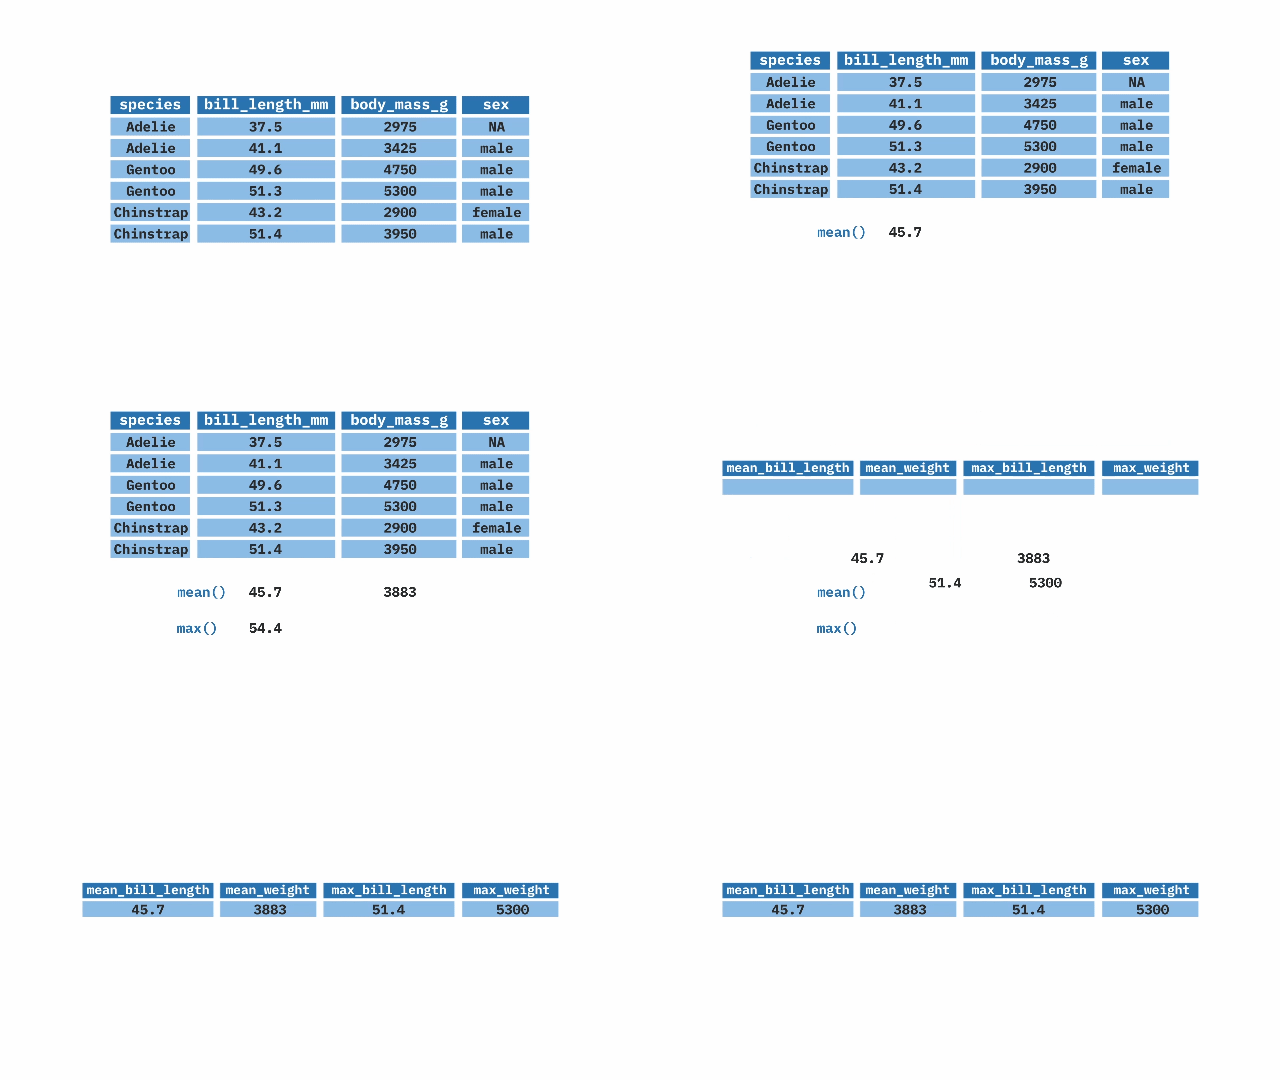
The summarize() function from the dplyr package in R aids in generating summaries of our data. With this function, we can compute mean, min, max, median, and other statistical measures of our variables.
Animation
Sample Code
library(tidyverse)
library(palmerpenguins)

penguins |>
  summarize(
    mean_bill_length = mean(bill_length_mm, na.rm = TRUE),
    mean_weight = mean(body_mass_g, na.rm = TRUE),
    max_bill_length = max(bill_length_mm, na.rm = TRUE),
    max_weight = max(body_mass_g, na.rm = TRUE)
)group_by() + summarize()
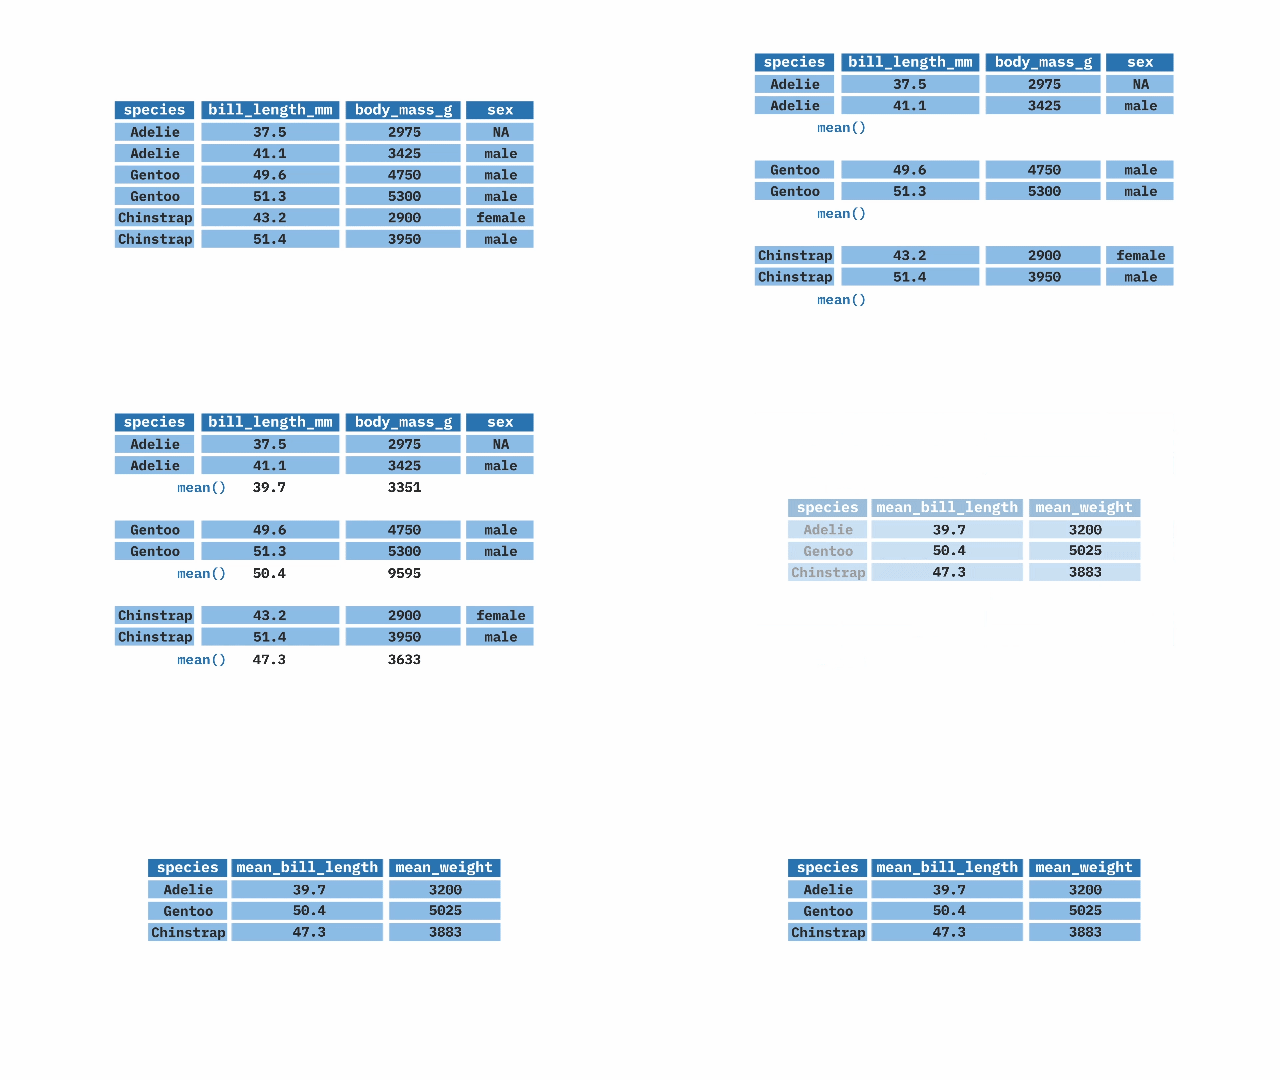
The group_by() function from the dplyr package in R is used in combination with summarize() to create summaries of our data by groups. It can be applied to one or more variables, creating a grouping that summarize() will use to calculate the summary statistics separately for each group (e.g. the average weight for each penguin species).
Animation
Sample Code
library(tidyverse)
library(palmerpenguins)

penguins |>
  group_by(species) |>
  summarize(
    mean_bill_length = mean(bill_length_mm, na.rm = TRUE),
    mean_weight = mean(body_mass_g, na.rm = TRUE)
)arrange()
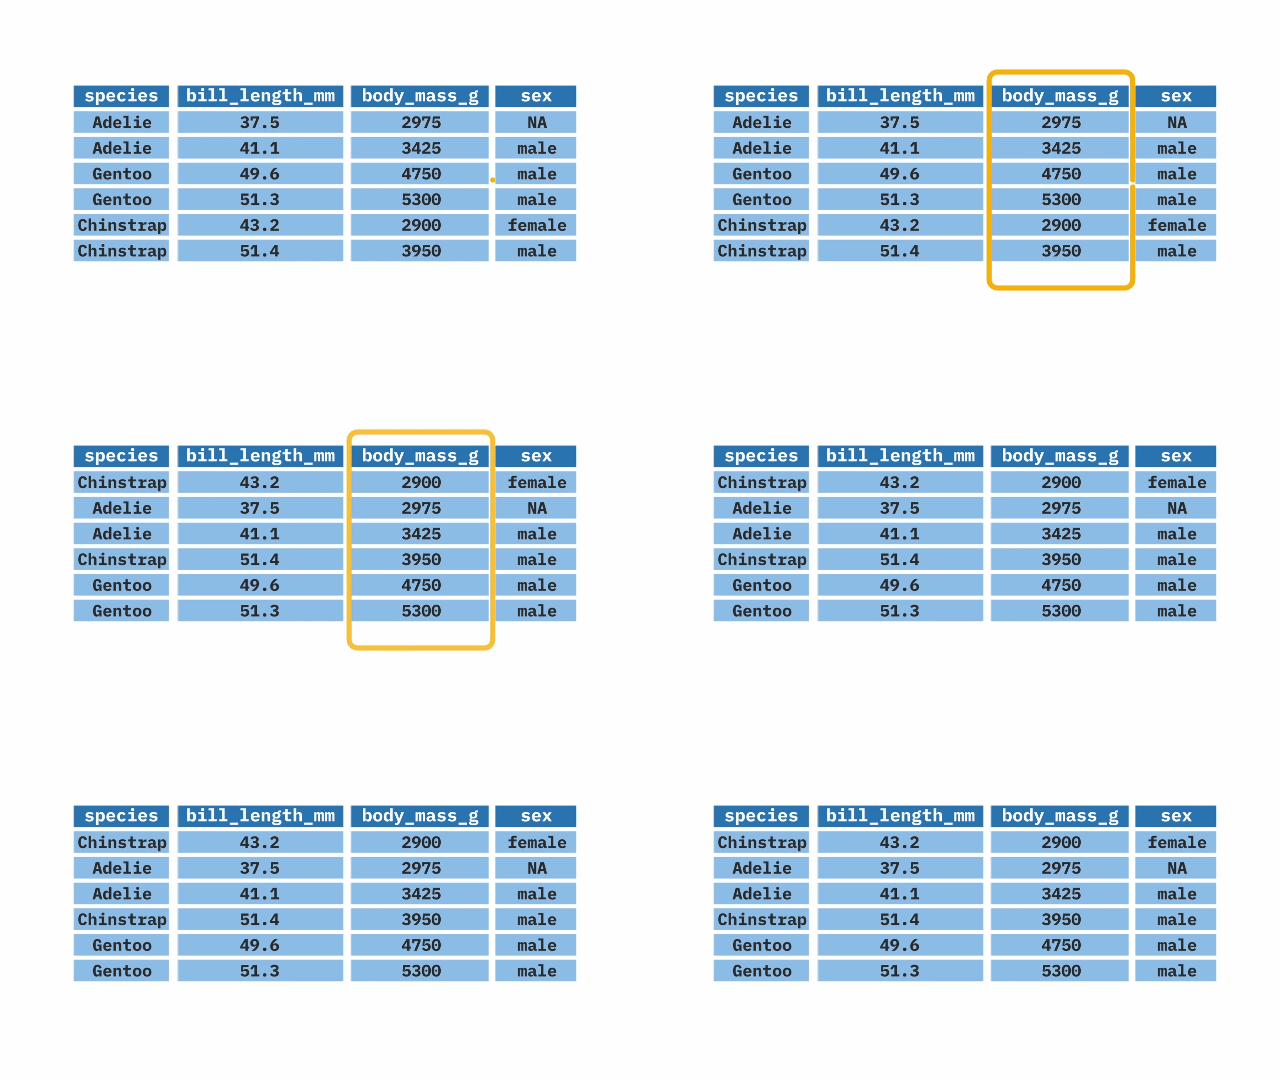
The arrange() function from the dplyr package in R allows us to reorder our data based on a certain variable. It sorts the variable in ascending order by default, but can also sort in descending order when combined with the desc() function. The arrange() function is often used at the end of a pipeline to display the data in a certain order.
Animation
Sample Code
library(tidyverse)
library(palmerpenguins)

penguins |>
arrange(body_mass_g)Learn More
I'm not the only one who has made animated versions of common functions from the dplyr package. For another take on this, check out Andrew Heiss's blog.
If you want to learn to use these functions in your own work, check out the course Fundamentals of R.
Sign up for the newsletter
Get blog posts like this delivered straight to your inbox.
You need to be signed-in to comment on this post. Login.