From Overwhelm to Organization: Optimizing Data Workflows in R
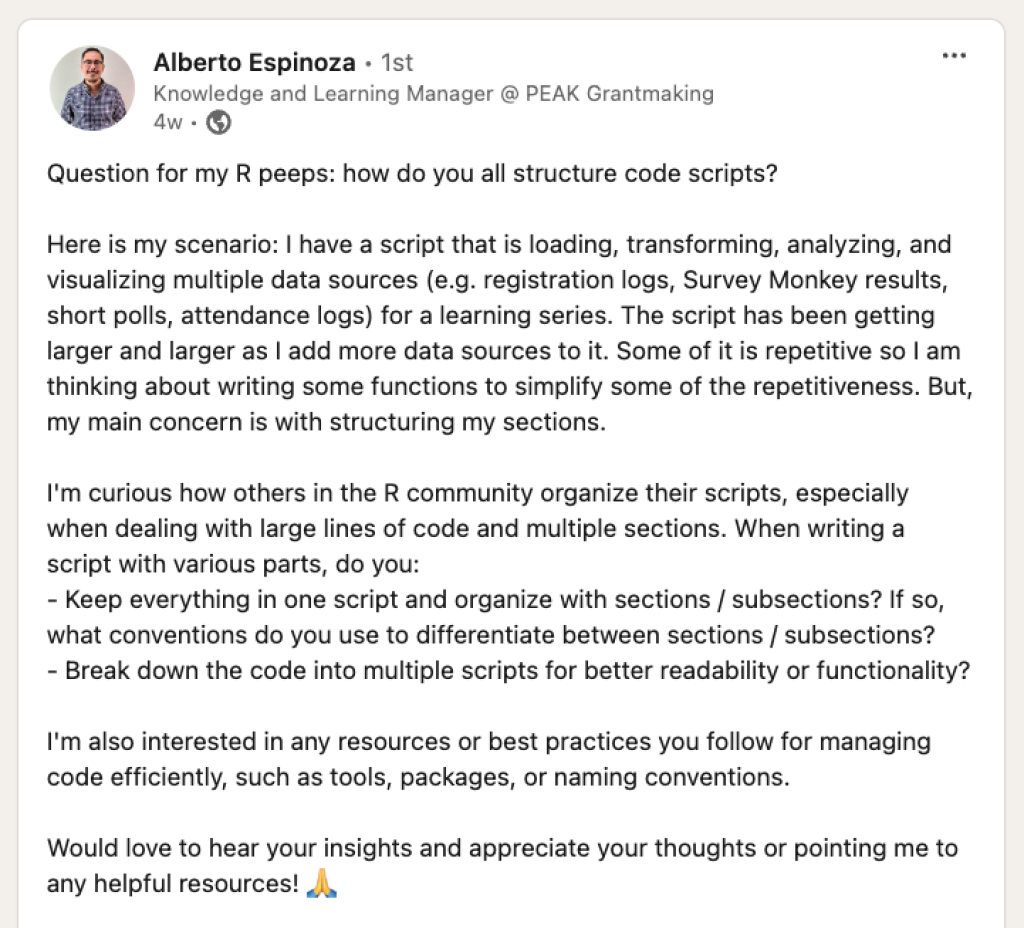
Ever feel overwhelmed by a messy R script that's grown out of control? That's exactly what happened to Alberto Espinoza, Knowledge and Learning Manager at PEAK Grantmaking.
In his job at PEAK Grantmaking, an organization that helps philanthropy to use equitable, effective grantmaking practices, Alberto supervises a Grants Management 101 class. As part of this training, Alberto has to analyze data from surveys that participants complete. With this training happening regularly, the data from it has gotten large, as has the code that Alberto created to wrangle it. He needed help getting organized before starting a new round of the class. He posted on LinkedIn to ask others for advice on how they structure their code.
I reached out to Alberto and suggested we do a call so I could show him how I structure projects. We had this call and I recorded it. In it, we go over Alberto's code, which consisted of one extra-long R script file that was doing everything - loading data from multiple sources, cleaning it, analyzing it, and creating visualizations. On our call, I shared my approach to organizing R projects in a way that makes them easier to maintain and reuse. Here are the key things I recommended to Alberto:
Separate data cleaning from analysis by creating different scripts
Use RDS files to save cleaned data (bonus: they preserve variable types!)
Structure your project with folders for raw and processed data
Use the
source()function to run your data cleaning script from your analysis document when needed
The best part? This approach means you spend more time upfront getting your data cleaned and tidied, but then the analysis becomes way more efficient. No more constantly jumping back and forth between cleaning and analysis!
Code from Our Conversation
Sign up for the newsletter
Get blog posts like this delivered straight to your inbox.

You need to be signed-in to comment on this post. Login.