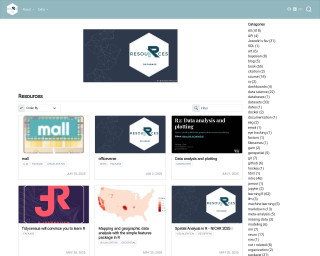
Resources
This carefully curated collection of resources will help you find packages and learning resources to help you on your R journey.
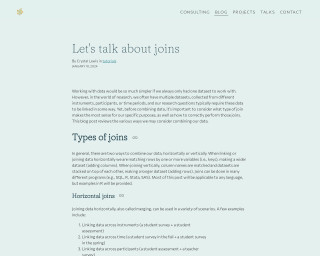
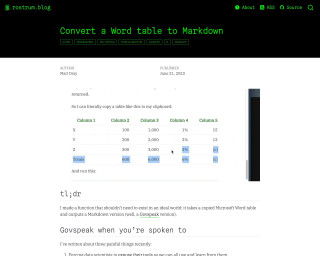
Let's talk about joins
This content provides a tutorial by Crystal Lewis on how to perform joins in data analysis, both horizontal and vertical, using SQL, R, Stata, SAS, or other programs. It explains different types of joins such as left, right, full, and inner joins, and the scenarios in which they might be used, like linking data across instruments, time, or participants. Lewis further details two important rules for horizontal joins related to variable naming and keys, ensuring the proper merging of datasets without duplication or data loss.
Go to Resource
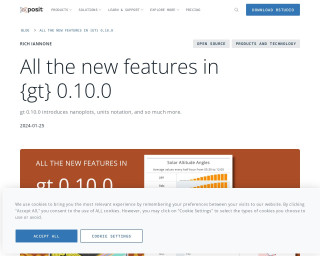
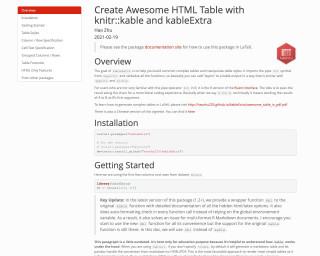
New features in {gt} package
The blog post highlights the new features introduced in {gt} 0.10.0, a package for creating tables in R. Developed by Posit, formerly RStudio, the update includes novel functionalities like nanoplots and units notation. Rich Iannone, a software engineer at Posit, outlines these enhancements. He's known for his work on R packages like {gt} and {blastula} and his contributions to the Quarto project. His talk of exploration and adventure reflects his passion beyond coding. The article encourages subscribing for more insightful open-source data science content.
Go to Resource

R for Sign Language Linguistics
This content is a tutorial by Carl "Calle" B{"o}rstell on leveraging R for sign language linguistics, published on August 17, 2023. It targets sign language linguists who are familiar with R, mentioning helpful resources and focusing on handling ELAN files (.eaf) using the {tidyverse} and custom functions in R. The tutorial introduces the {signglossR} package and the read_elan() function for importing ELAN files into R for data analysis, and details steps for reading, storing, and pivoting ELAN annotation data into wide format, with examples provided.
Go to Resource
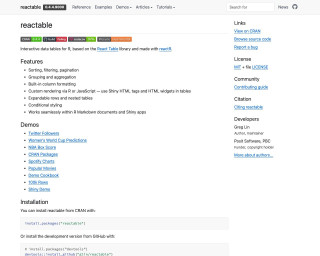
reactable
Interactive data tables for R, based on the React Table library and made with reactR.
Go to Resource

Reactable Tutorial
This tutorial provides a guide on using the reactable package in R to create interactive data tables. It covers topics such as setting up the package, modifying column properties, adjusting width and alignment, rendering cell values as HTML, and grouping and aggregation.
Go to Resource
resouRces
This content encompasses a comprehensive list of R-related educational materials, packages, tutorials, and datasets with projected dates ranging up to the year 2025. It includes various titles that focus on learning R programming, data analysis, data visualization, geospatial mapping, and statistical methods. Significant emphasis is placed on resources for learning R, such as introductions to R, books, courses, and video tutorials. Additionally, specific packages for data wrangling, statistical modeling, and visualization are mentioned, indicating the evolution and specialization of R's ecosystem to cater to diverse data science needs.
Go to Resource

The best R packages for data visualization
The best R packages for data visualization provide a comprehensive suite of tools for creating all types of charts and graphs. Core to R's visualization capabilities is the package ggplot2, which offers a versatile grammar of graphics. Extensions of ggplot2 and other packages expand these functionalities, allowing for interactive charts, improved aesthetics, specialized geospatial analysis, and managing complex data structures like networks. Packages like plotly, rmarkdown, patchwork, and hrbrthemes enhance the user experience and presentation. Additionally, there are packages dedicated to managing colors, creating tables, and supporting specific chart types like word clouds and streamgraphs.
Go to Resource
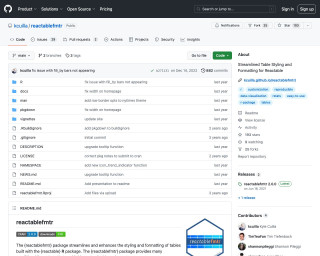
Why R? Webinar 037 - D. Gohel - Tabular reporting with the flextable package - YouTube
This is a webinar titled 'Tabular reporting with the flextable package' by D. Gohel. It is a part of the 'Why R?' webinar series and is available on YouTube.
Go to Resource