Resources
This carefully curated collection of resources will help you find packages and learning resources to help you on your R journey.
Data Cleaning Flipbook
A flipbook with examples of data cleaning using R and the tidyverse package
Go to Resource
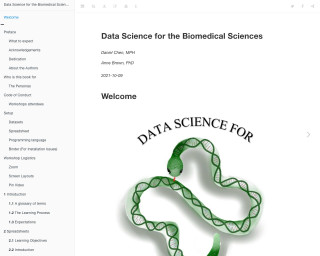
Data Science for the Biomedical Sciences
Data Science for the Biomedical Sciences is a book that provides an introduction to data science concepts and tools specifically tailored for the biomedical sciences. It covers topics such as spreadsheets, R and RStudio, data loading, descriptive calculations, data cleaning, visualization, analysis, working with multiple datasets, APIs, functions, survival analysis, machine learning, and more.
Go to Resource
How (and Why) I came to Use R for Data Analysis and Evaluation
Alberto Espinoza recounts his journey with R for data analysis and evaluation, marking his 10-year experience since first encountering R during his graduate assistantship. Initially clueless about R, he was tasked with assisting and leading statistics labs using R. Despite early challenges and a steep learning curve, he recognized R's power over software like SPSS or Excel. His continued use of R spanned graduate projects, market research, data preparation for Tableau, and Survey Monkey analysis. Espinoza outlines R's advantages: reproducibility, efficiency, clarity, and an extensive package ecosystem, underlining R's significance in his professional growth.
Go to Resource
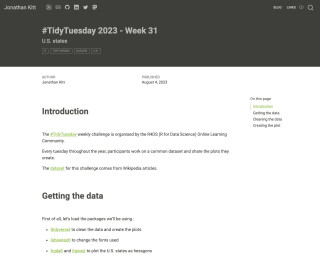
Jonathan Kitt - #TidyTuesday 2023 - Week 31
This is a tutorial on how to participate in the #TidyTuesday weekly challenge, organized by the R4DS Online Learning Community. The tutorial covers loading packages, downloading the dataset, cleaning the data, and creating visualizations.
Go to Resource
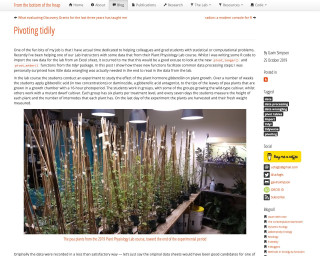
Pivoting tidily
This post discusses the new pivot_longer() and pivot_wider() functions from the tidyr package in R. It demonstrates how these functions can facilitate common data processing steps and reduce the need for extensive data wrangling. The post uses an example from a Plant Physiology Lab course to illustrate the use of these functions.
Go to Resource
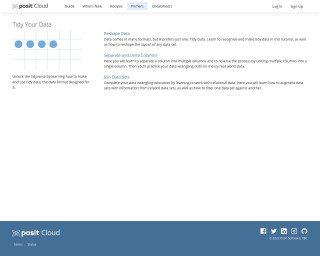
RStudio Cloud Primer: Tidy Your Data
Posit Cloud is a cloud-based platform that provides data storage and analysis tools for the R programming language.
Go to Resource
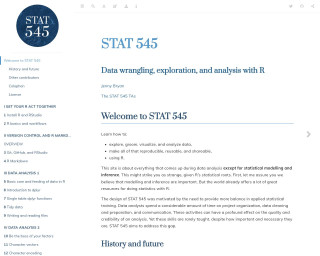
Stat545
This is the table of contents for the STAT 545 resource, which covers various topics related to R programming.
Go to Resource
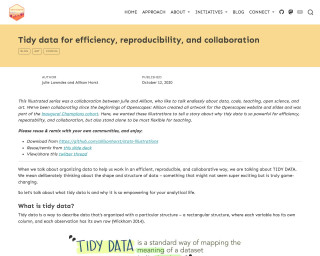
Tidy data for efficiency, reproducibility, and collaboration
This illustrated series discusses the power of tidy data for efficiency, reproducibility, and collaboration in data science. It emphasizes the importance of organizing data in a structured and standardized format, which enables the use of existing tools, facilitates collaboration, and enhances reproducibility. The series provides examples and resources for working with tidy data and highlights its benefits in data analysis and research.
Go to Resource
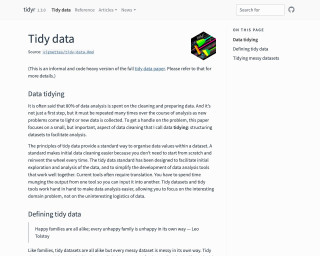
Tidy Data Vignette
Tidy data is a concept in data analysis that involves structuring datasets to facilitate analysis. The tidy data standard provides a standardized way to organize data values within a dataset. This resource is a vignette that explains the principles and importance of tidy data and provides examples in R using the tidyr package.
Go to Resource

Tidy Flowchart Generator
The Tidy Flowchart Generator, or the 'flowchart' package, is an R package designed for drawing participant flow diagrams directly from a dataframe, employing the tidyverse syntax. It offers a suite of functions that utilize the pipe operator to generate flowcharts conveniently and flexibly from dataframes. The package is accessible through CRAN and can be installed traditionally or via the development version on GitHub. The process of creating a flowchart with this tool is demonstrated through a GIF example on its homepage, showcasing its usefulness in drafting flow diagrams for clinical trials or similar studies.
Go to Resource