Resources
This carefully curated collection of resources will help you find packages and learning resources to help you on your R journey.

Enhance Quarto Project Workflows and Standards • froggeR
froggeR is an R package designed to enhance Quarto project workflows for R users. It provides a suite of functions that automate project setup tasks, enforce consistent documentation, and allow users to focus on analysis rather than configuration. The package includes features for creating Quarto projects with custom templates, managing YAML headers, applying git protection with a comprehensive .gitignore, styling documents with SCSS templates, and generating structured project documentation. It's particularly useful for R users managing multiple Quarto projects, encouraging collaboration, and standardizing project structures.
Go to Resource
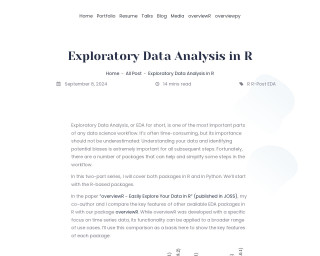
Exploratory Data Analysis in R
This content details the process of Exploratory Data Analysis (EDA) using R. It emphasizes the importance of EDA as a crucial part of data science, particularly in understanding data and identifying biases. The article introduces several R packages that facilitate EDA, including overviewR, which is particularly focused on time series data analysis but is applicable to other data types. Key features of each package are compared, and the usage of the {palmerpenguins} dataset is illustrated. Package installation, data loading, and functions like str() and summary() are discussed, giving readers an introduction to effective data analysis in R.
Go to Resource
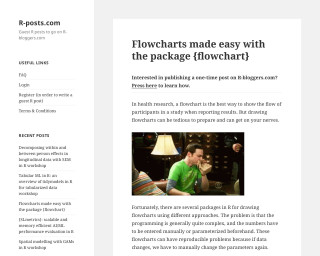
Flowcharts made easy with the package {flowchart}
The {flowchart} package in R facilitates the creation of flowcharts, particularly useful in health research to show participant flow in studies. It integrates with the tidyverse workflow, offering customizable functions that work with pipe operators. Unlike other packages, it adapts flowcharts automatically to the data, enhancing reproducibility. The post explains installation, initialization, and drawing processes using the SAFO clinical trial dataset. It's easy to produce complex flowcharts without manual parameter setting thanks to the package's tidyverse-centric design.
Go to Resource
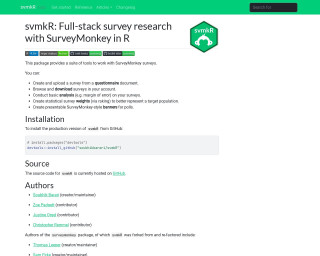
Full-Stack Survey Research with SurveyMonkey • svmkR
svmkR is an R package that provides a comprehensive toolkit for managing SurveyMonkey surveys within the R programming environment. It enables users to create, upload, download, and analyze surveys directly from R. Users can calculate margins of error, apply statistical survey weights through raking, and generate SurveyMonkey-style banner presentations for polls. The package is installed from GitHub and serves as a full-stack survey research solution. The source is available on GitHub, and the package was developed by a team of contributors, building on the surveymonkey package by enhancing and refactoring it.
Go to Resource
How (and Why) I came to Use R for Data Analysis and Evaluation
Alberto Espinoza recounts his journey with R for data analysis and evaluation, marking his 10-year experience since first encountering R during his graduate assistantship. Initially clueless about R, he was tasked with assisting and leading statistics labs using R. Despite early challenges and a steep learning curve, he recognized R's power over software like SPSS or Excel. His continued use of R spanned graduate projects, market research, data preparation for Tableau, and Survey Monkey analysis. Espinoza outlines R's advantages: reproducibility, efficiency, clarity, and an extensive package ecosystem, underlining R's significance in his professional growth.
Go to Resource
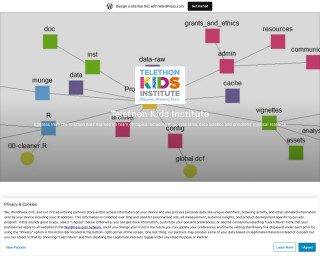
How Do You Organise Your R Project? This Is What We Do.
This blog post discusses how the Biometrics group at Telethon Kids Institute organizes their R projects using a standardized template project directory. The post covers the project directory structure, reproducible research practices, and the use of version control.
Go to Resource
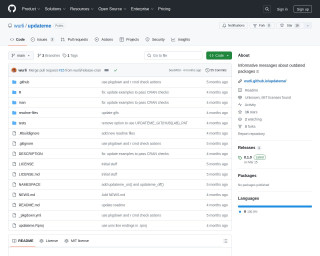
Keep your packages up-to-date with minimal hassle
{updateme} is an R package that enhances the library() function by displaying informative messages about the current status of loaded packages with respect to their latest versions. It supports packages installed from CRAN, Bioconductor, GitHub, and GitLab. The tool provides configurations for checking updates and can be easily integrated into the R startup process. The package also features caching mechanisms to improve performance and can be toggled on or off as needed. It's designed to help R users keep their packages up-to-date with minimal hassle.
Go to Resource

Learning R as a SAS user
This article provides valuable resources and tips for learners transitioning from SAS to R. It introduces the Sassy system of packages, which mimics familiar SAS outputs, and offers links to useful cheatsheets and videos for R learners. The author acknowledges the unique challenges faced by former SAS users and organizes tips from data loading to execution advice, catering to various skill levels. The article aims to ease the learning curve and enhance the R programming experience for individuals accustomed to SAS.
Go to Resource

Lots is happening in the LLM/R space!
Veerle Eeftink - van Leemput discusses the rapid development of R and LLM-related software, detailing new packages and tools that integrate Large Language Models (LLMs) with R. She highlights packages that facilitate API calls, context-aware assistance, and NLP tasks without training custom models. Notable contributions from Simon P. Couch and other developers are mentioned, including tools for evaluating LLM performance, error handling, unit testing, and sentiment analysis. The post hints at R's vitality in the LLM ecosystem and includes links to GitHub repositories for further exploration.
Go to Resource
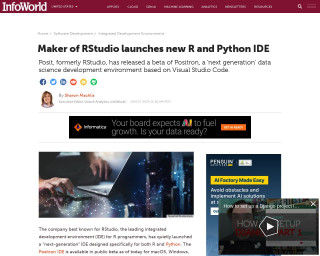
Maker of RStudio launches new R and Python IDE
Posit, previously known as RStudio, released a beta version of its new integrated development environment (IDE) called Positron. Tailored for data science, Positron supports both R and Python programming languages and is based on Visual Studio Code. It simplifies setup for R and Python without needing additional extensions, unlike standard VS Code. Positron includes built-in features like a data explorer for viewing and interacting with data frames. It is available on macOS, Windows, and Linux and integrates with the OpenVSX registry for extensions, highlighting Posit's support for OpenVSX. The IDE emphasizes a code-first approach with additional tools to aid data examination.
Go to Resource
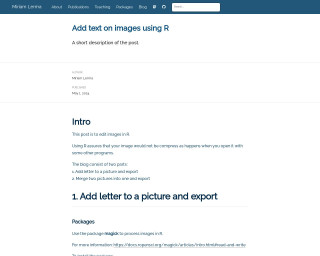
Miriam Lerma: Add text on images using R
This article explains how to add text to images in R and merge two images using the {magick} package. It covers installation and usage of the package, selecting the working directory, and loading images with 'image_read'. The article demonstrates how to annotate images with text at specific locations and export the modified images using 'image_write'. Additionally, it shows how to add a border to images and combine them side by side into a single image before exporting. The guide includes code snippets and is suitable for those looking to edit images programmatically in R without image compression issues.
Go to Resource

Positron IDE - A new IDE for data science
Dr. Mowinckel reviews Positron IDE, a new data science-oriented IDE that's evolved from Visual Studio Code. The blog explores Positron's compatibility with R and discusses its features, such as integration with Rmd, Hugo websites, and RStudio projects. It analyzes the ease of transitioning from other IDEs, like RStudio, highlighting Positron's customizability, multi-language support, and environment setup. Comparisons are made with other IDEs, underscoring Positron's suitability for polyglot programmers and its potential as a preferred tool. The writer reflects on the learning curve and extensibility, giving insights into making Positron an effective data science environment.
Go to Resource