Resources
This carefully curated collection of resources will help you find packages and learning resources to help you on your R journey.
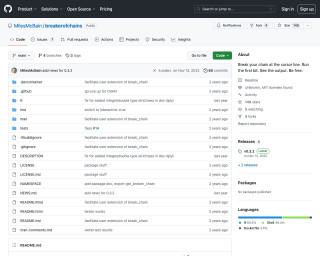
breakerofchains
Break your chain at the cursor line. Run the first bit. See the output. Be free.
Go to Resource
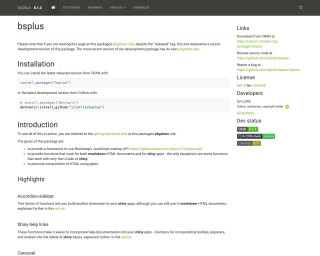
bs4Dash
bs4Dash is a Bootstrap 4 version of shinydashboard, a package for creating dashboards with Shiny in R. This article provides information on how to upgrade from shinydashboard to bs4Dash.
Go to Resource
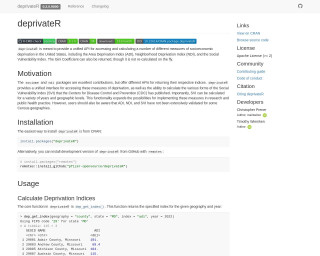
Calculating and Analyzing Measures of Deprivation in the United States with deprivateR
deprivateR is an R package designed to provide a unified API for calculating and accessing various socioeconomic deprivation indices in the United States, such as the Area Deprivation Index (ADI), Neighborhood Deprivation Index (NDI), and Social Vulnerability Index (SVI), along with the Gini Coefficient. It offers a straightforward interface to compare indices across years and geographies, useful in research and public health. Though valuable, users should note some indices have limited validation for certain Census geographies. The package is available on CRAN and GitHub for easy installation and includes core functions like dep_get_index() and dep_calc_index() for computing deprivation scores using data like the American Community Survey.
Go to Resource

Chat with Large Language Models • {ellmer}
The 'ellmer' package facilitates the use of large language models (LLMs) directly from R. It provides access to multiple LLM providers and features like streaming outputs and structured data extraction. 'ellmer' supports models such as Anthropic's Claude, AWS Bedrock, and OpenAI's GPT, among others. The package offers interactive and programmatic ways to converse with models, maintaining the conversation state, which is useful for building on previous interactions. 'ellmer' is practical for both organizational and personal use, accommodating various IT restrictions and preferences.
Go to Resource
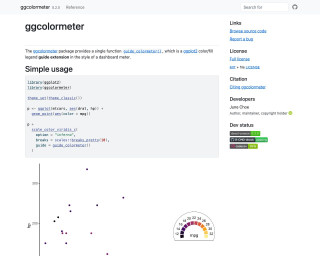
Colormeter Guide Extension • ggcolormeter
The ggcolormeter package provides a single function guide_colormeter() which is a ggplot2 color/fill legend guide extension in the style of a dashboard meter.
Go to Resource
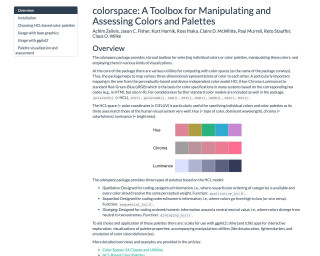
colorspace: A Toolbox for Manipulating and Assessing Colors and Palettes
colorspace is a toolbox for manipulating and assessing colors and palettes in the R language. It provides utilities for computing with color spaces, such as converting between different color models. The package also includes predefined color palettes and functions for creating customized palettes. It can be used for visualizations and choosing colors in data analysis and graphic design.
Go to Resource
Compute and Visualize Wildfire Exposure • fireexposuR
fireexposuR is an R package designed for computing and visualizing wildfire exposure with a focus on aiding wildfire management. It automates established methodologies, offers customization for various use cases and geographies, and enables output visualization. Users from varied sectors like research, government, and forestry can benefit, but a solid understanding of wildland fuels, spatial data, and R is recommended. The package ensures accessibility and encourages users to familiarize themselves with the underpinning scientific theories for effective use. It doesn't simplify the complexities of theory, data preparation, or parameter decision-making intrinsic to wildfire exposure assessments.
Go to Resource