Resources
This carefully curated collection of resources will help you find packages and learning resources to help you on your R journey.
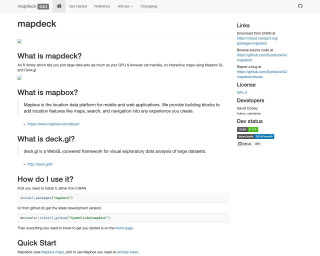
mapdeck
An R library for plotting large datasets on interactive maps using Mapbox GL and Deck.gl
Go to Resource

mazegenerator: Maze generator built in R
Mazegenerator is a project on GitHub by matfmc for generating mazes using R. It leverages a random walk algorithm to create mazes and provides tools for visualization. It offers features such as generating custom-sized mazes, visualizing the generation process with animations, customizable aesthetics, and export functions for the mazes. It can display node numbers and paths, and it requires the 'magick' package in R for installation. Users can create mazes, adjust their properties, and generate static or animated visual representations of the maze generation process using the provided R scripts.
Go to Resource
Modern Data Science with R
Modern Data Science with R is a comprehensive data science textbook that incorporates statistical and computational thinking to solve real-world problems with data. It covers topics such as data wrangling, data visualization, inferential statistics, and more. The book is currently in its 3rd edition and includes updates and changes to reflect the evolving R ecosystem. It also provides instructor resources, reviews, and errata on its website.
Go to Resource
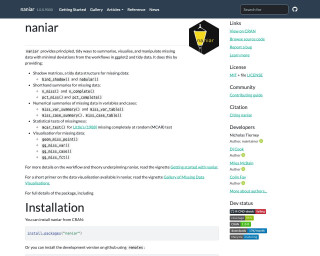
naniar
naniar provides principled, tidy ways to summarise, visualise, and manipulate missing data with minimal deviations from the workflows in ggplot2 and tidy data.
Go to Resource
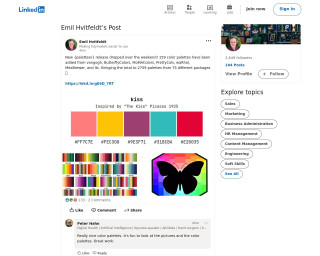
New {paletteer} release dropped over the weekend! 159 color palettes have been added
The content discusses Emil Hvitfeldt's LinkedIn post about a new release of the {paletteer} R package, which added 159 color palettes, bringing the total to 2759 palettes from 75 packages. It highlights the usefulness and aesthetic appeal of the palettes as articulated by community members, demonstrating the package's positive reception and usage within data visualization in R.
Go to Resource
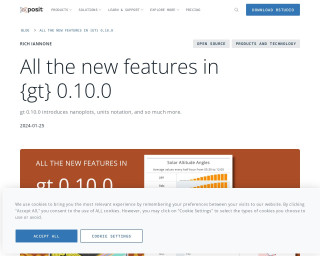
New features in {gt} package
The blog post highlights the new features introduced in {gt} 0.10.0, a package for creating tables in R. Developed by Posit, formerly RStudio, the update includes novel functionalities like nanoplots and units notation. Rich Iannone, a software engineer at Posit, outlines these enhancements. He's known for his work on R packages like {gt} and {blastula} and his contributions to the Quarto project. His talk of exploration and adventure reflects his passion beyond coding. The article encourages subscribing for more insightful open-source data science content.
Go to Resource
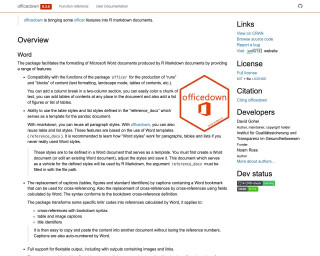
officedown
officedown is an R package that enhances the formatting of Microsoft Word and PowerPoint documents produced by R Markdown. It provides features such as compatibility with the functions of the package officer, the ability to use table styles and list styles defined in a Word template, and support for flextable output. officedown also enhances PowerPoint productions by providing a mechanism for placing results according to a slide template contained in the PowerPoint document. For more information, refer to the package documentation.
Go to Resource
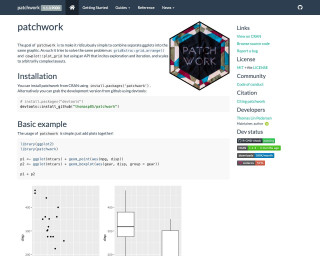

patchwork 1.3.0
patchwork 1.3.0 introduces exciting new features for creating multifigure plot compositions, adding support for beautifully formatted tables alongside figures with native support for gt objects. Enhanced by Teun Van den Brand's contributions, it allows users to seamlessly integrate tables using the wrap_elements() method or with table-specific formatting via wrap_table(). This version optimizes the space utilization of tables within plots, aligning components perfectly and providing formatting options for an improved aesthetic and functional integration of data visualizations and tabular presentations.
Go to Resource
purrr
Purrr is a package in R that enhances functional programming (FP) toolkit by providing a complete and consistent set of tools for working with functions and vectors.
Go to Resource