Interactive Map Development for the San Francisco Asian Pacific Islander Council
In March 2021, Kathleen Doll from Intention2Impact contacted R for the Rest of Us to collaborate on a project with the Asian Pacific Islander (API) Council. The project aimed to map food resources for San Francisco's API community, highlighting available resources and identifying gaps.
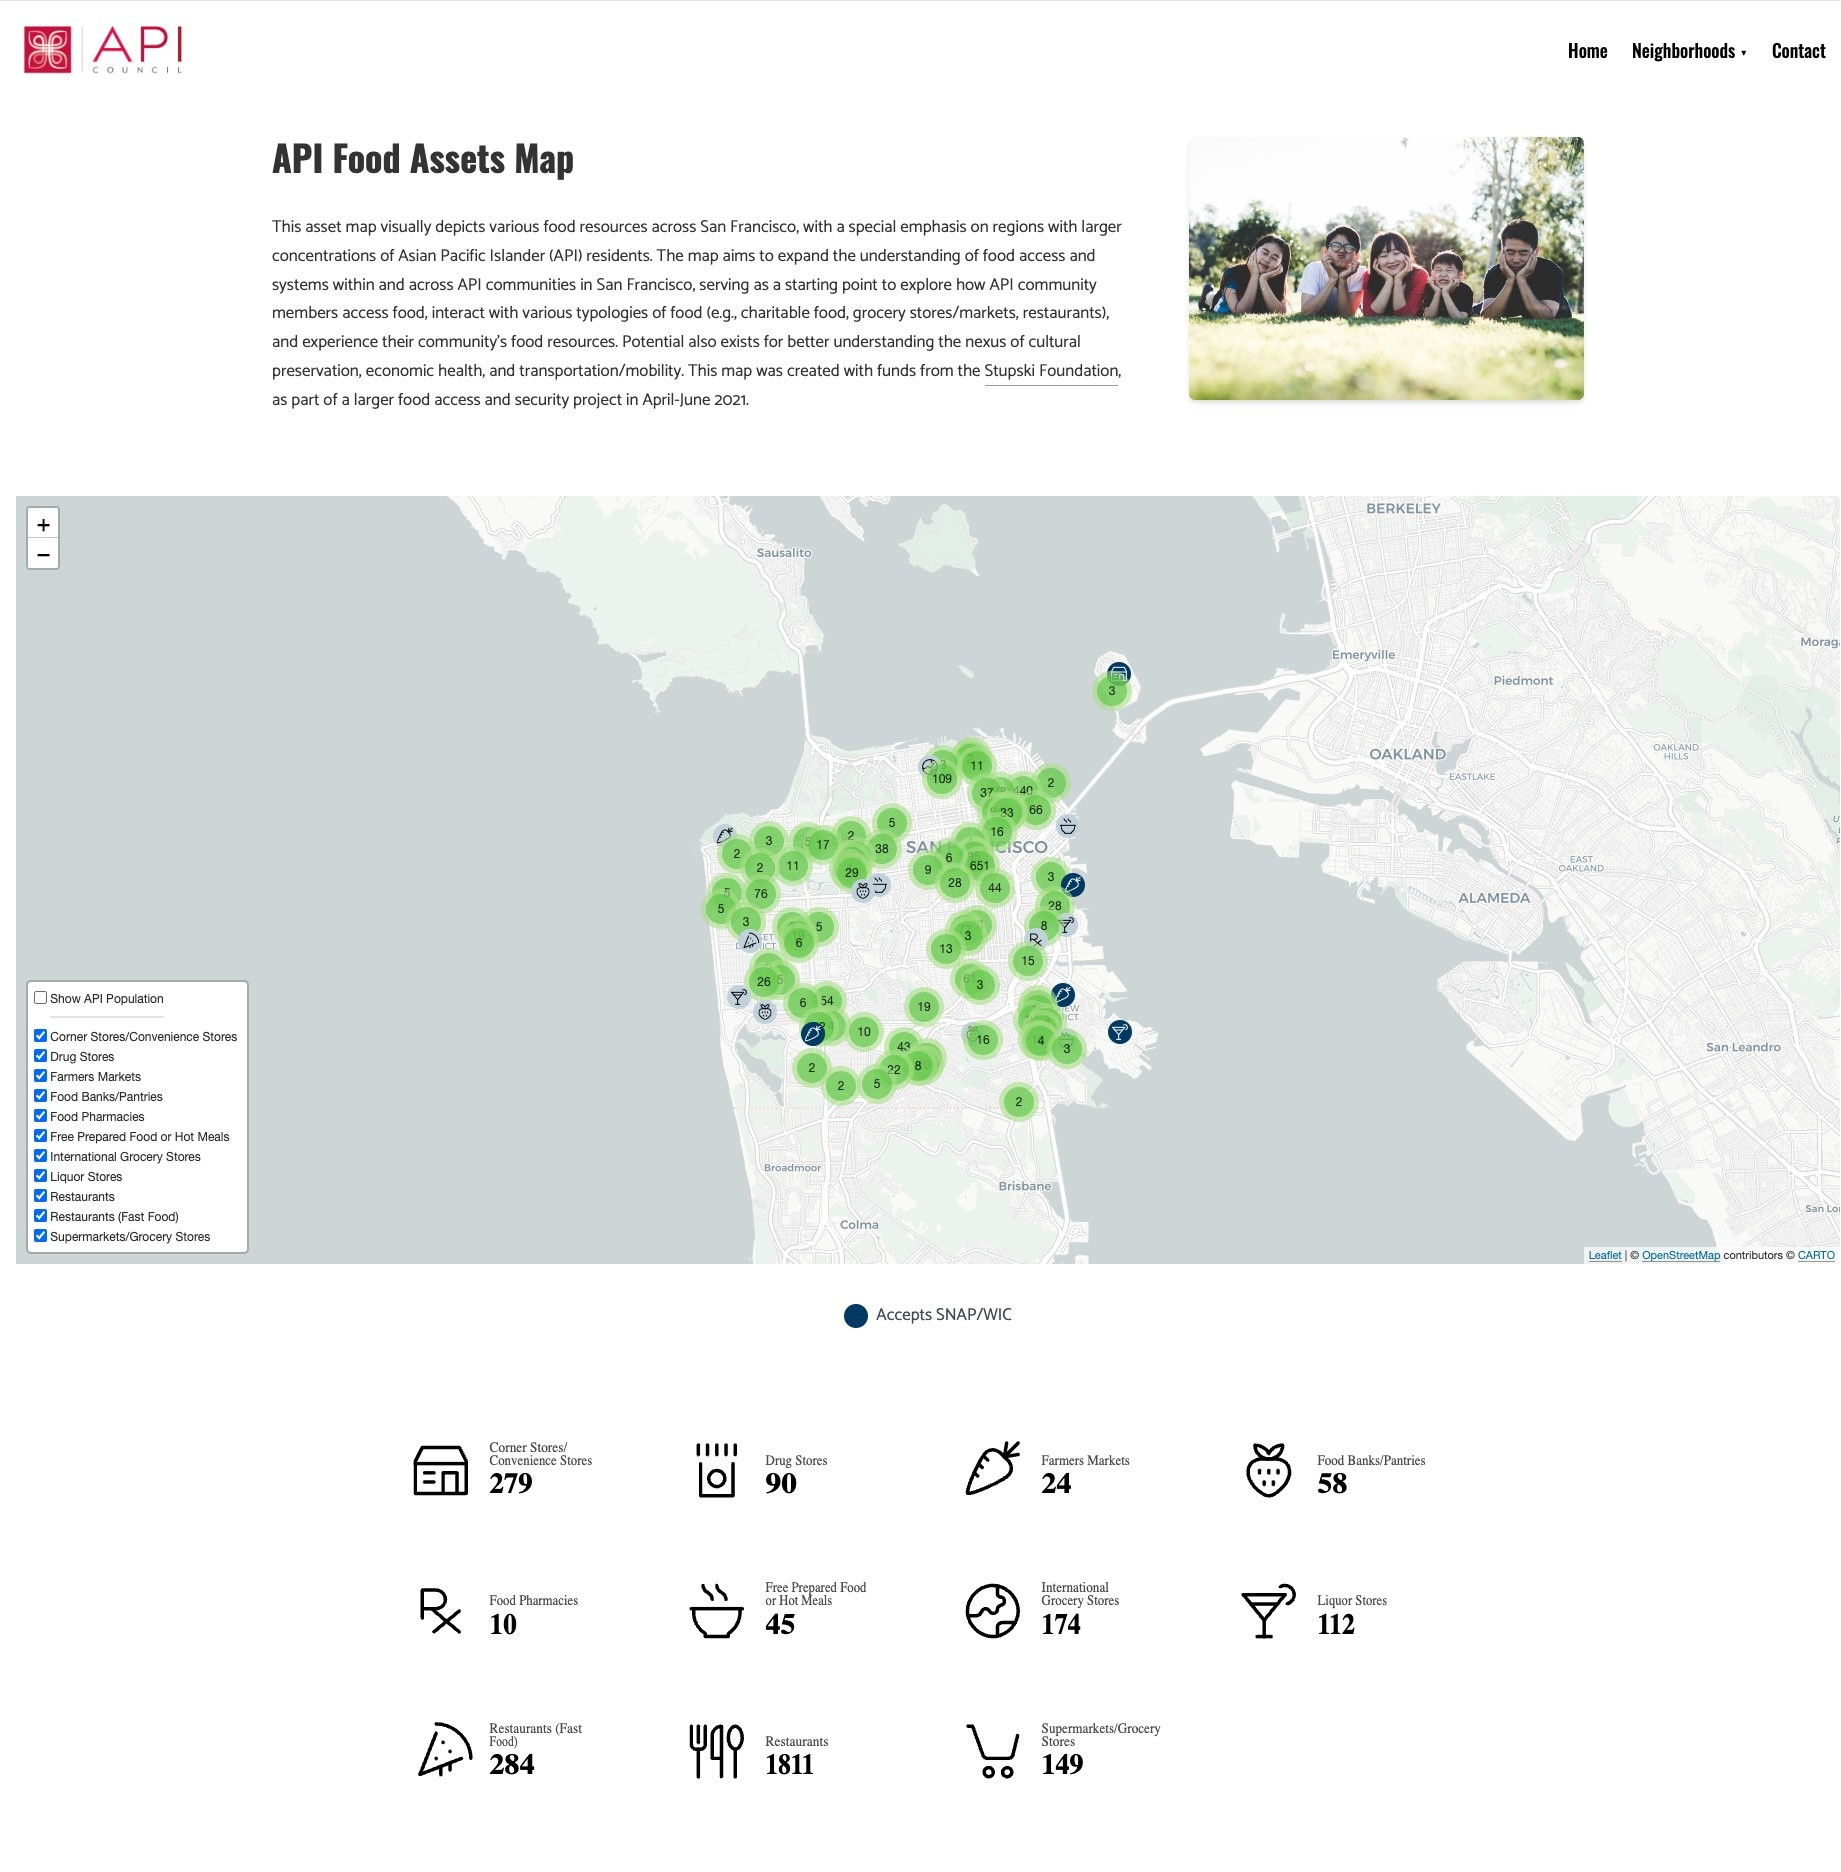
Kathleen's team initially planned to manually gather data on food resources, but R for the Rest of Us automated the process using R programming. They utilized the tidycensus package for population data, osmdata for food resource data, and rvest and RSelenium for web scraping. After ensuring data accuracy, they created an interactive map hosted on a website, featuring city-wide and neighborhood-specific maps. The maps, designed to match API Council’s branding, can be easily updated by re-running the R code, ensuring they always reflect the latest information on food resources for the API community in San Francisco.In March 2021, Kathleen Doll from Intention2Impact partnered with R for the Rest of Us and the Asian Pacific Islander (API) Council to map food resources for San Francisco's API community. Initially planning manual data collection, they instead automated the process using R. They gathered population data with tidycensus, food resource data with osmdata, and additional data via web scraping. After ensuring data accuracy, they created an interactive website map, featuring both city-wide and neighborhood-specific maps. These maps, matching the API Council’s branding, can be easily updated by re-running the R code, providing the latest food resource information.
Interested in learning more about our consulting services?
Drop us a line below.