A Guide to R for Excel Users
Many of the clients I work with are coming from Excel. When I teach them R, I try to relate new information to things they are already familiar with. In that spirit, I've put together a short video that shows some key functions (select, mutate, filter, summarize, group_by, and arrange) from the dplyr package in R. If you've ever wondered, say, what the equivalent of the filter function would be in Excel, I've got you covered!
A rendered version of the RMarkdown document used in the video is below (a version with slides is here).
Pipes
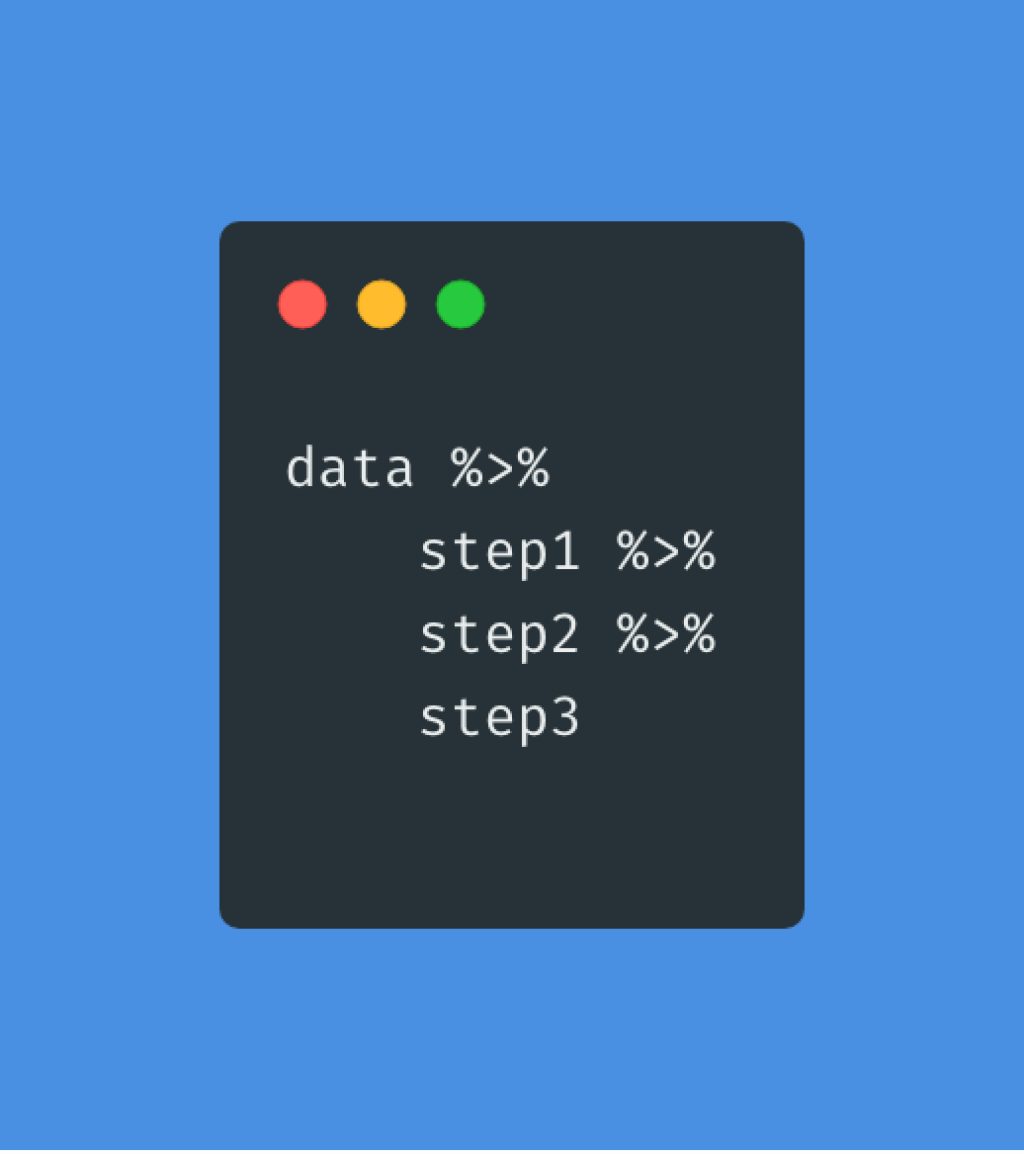
One thing not covered in this video is the pipe (for more, see this post). Written as %>% it enables you to chain together a series of functions on a data frame. So, for example, you:
Filter to only include those who are 150 centimeters or taller, then
Create a group for males and a group for females, then
Calculate the mean height.
All steps can be done in a single chunk of code, tied together with pipes. If you're coming from Excel, you might think of it as writing out a series of points and clicks that do a set of things on your original dataset.
Ready to Learn More?
Interested in learning more? The six functions discussed here, the pipe, and much more are covered in depth in my Fundamentals of R course.
Sign up for the newsletter
Get blog posts like this delivered straight to your inbox.

You need to be signed-in to comment on this post. Login.