How to Clean Messy Data in R
Data Cleaning with R
Interested in learning more about data cleaning with R? We now have a full course devoted to the topic.
If you work with data, you know that you often spend as much — if not more — time gathering, wrangling, and cleaning your data as you do analyzing it. A 2014 New York Times article cites the truism that data scientists spend at least half of their time cleaning data.
R offers a wide range of options for dealing with dirty data. The collection of packages known as the tidyverse, and adjacent packages that take a “tidy” approach, provide a range of functionality. From importing to cleaning to reshaping, these packages can help you quickly and efficiently clean messy data.
Provide Education on Good Practices
Receiving messy data can be extremely aggravating. It's common to see data savvy folks tell crazy stories about the messy data they receive (personal favorite: scanned images embedded into a Word document).
I'm seeking TRUE, crazy spreadsheet stories. Happy to get the actual sheet or just a description of the crazy. Also: I can keep a secret.
— Jenny Bryan (@JennyBryan) April 21, 2016
In many cases, these problems can be preemptively dealt with, and education is a great place to start. In particular, users who provide data in spreadsheets can be educated about some practices that make our lives as data analysts much easier. Two recent articles can help with this education process.
Karl Broman and Kara Woo's 2018 article titled Data Organization in Spreadsheets has tons of great tips. The abstract lays out several of them:
Spreadsheets are widely used software tools for data entry, storage, analysis, and visualization. Focusing on the data entry and storage aspects, this article offers practical recommendations for organizing spreadsheet data to reduce errors and ease later analyses. The basic principles are: be consistent, write dates like YYYY-MM-DD, do not leave any cells empty, put just one thing in a cell, organize the data as a single rectangle (with subjects as rows and variables as columns, and with a single header row), create a data dictionary, do not include calculations in the raw data files, do not use font color or highlighting as data, choose good names for things, make backups, use data validation to avoid data entry errors, and save the data in plain text files.
Another article in this genre of educating others comes from Luis Verde, Natalie Cooper, and Guillermo D’Elía. Though pitched at a particular audience, the article, titled Good practices for sharing analysis-ready data in mammalogy and biodiversity research, has some great lessons for everyone, no matter what your field. In particular, I appreciate their recommendation to avoid using PDFs to share data:
Despite its flexibility and portability, the PDF was not designed as a data format ... Even when content in a PDF page looks like a table or spreadsheet and was originally tabular, the format does not retain any sense of the unique cells that once contained the data. Tables in a PDF file are strategically-positioned lines and text, meaning that values cannot be easily copied and pasted into new aggregate datasets, or imported directly into statistical analysis programs.
Sharing articles like these can help you receive data that requires less cleaning, and who doesn't love that?
Use R Packages to Clean Messy Data
No matter how much education you provide, you'll always receive messy data. Fortunately, there are many packages to help you clean messy data. Below are a few of my favorites, but this is far from a comprehensive list!
The tidyverse has a collection of packages to deal with messy data (see dplyr and tidyr in particular) AND a philosophy that helps you in doing so. People use the phrase data cleaning to mean a wide range of things. While there are many overlaps in the specific tasks people include when discussing data cleaning, one person's definition of clean data can vary significantly from another person's definition. Having an end goal in mind for what counts as "clean data" lets you focus on getting to this goal, rather than having to constantly determine whether your data is clean yet. As Hadley Wickham writes:
The principles of tidy data provide a standard way to organise data values within a dataset. A standard makes initial data cleaning easier because you don't need to start from scratch and reinvent the wheel every time.
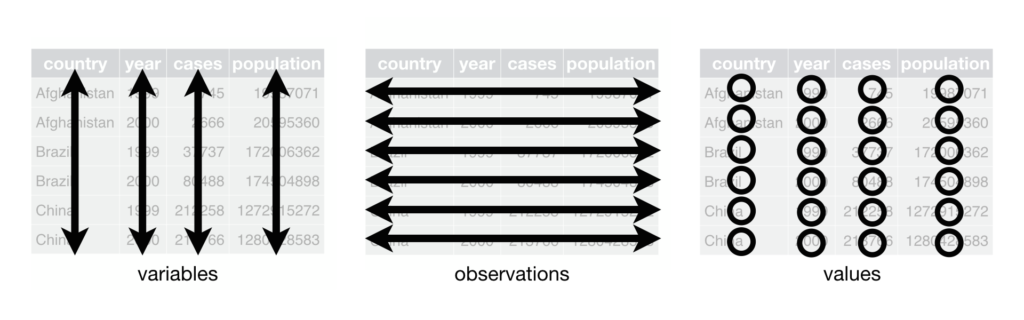
The details of tidy data go beyond the scope of this blog post (definitely read the article about it on the tidyr website), but these oft-repeated principles provide a great place to begin with your understanding:
Each variable forms a column.
Each observation forms a row.
Each type of observational unit forms a table.
readr
With the goal of tidy data in mind, the first step is to import data. A common issue with data you import are values (e.g. 999) that should be NAs. The na argument in the read_csv() function in the readr package is a great way to deal with these, as I demonstrate in this video from my free Getting Started course.
unheadr
Luis Verde has gone one step beyond co-authoring the article cited above by developing a package to help R users deal with the types of messy data that we often receive. Known as unheadr, its goal is to:
… help wrangle data when it has embedded subheaders, or when values are wrapped across several rows
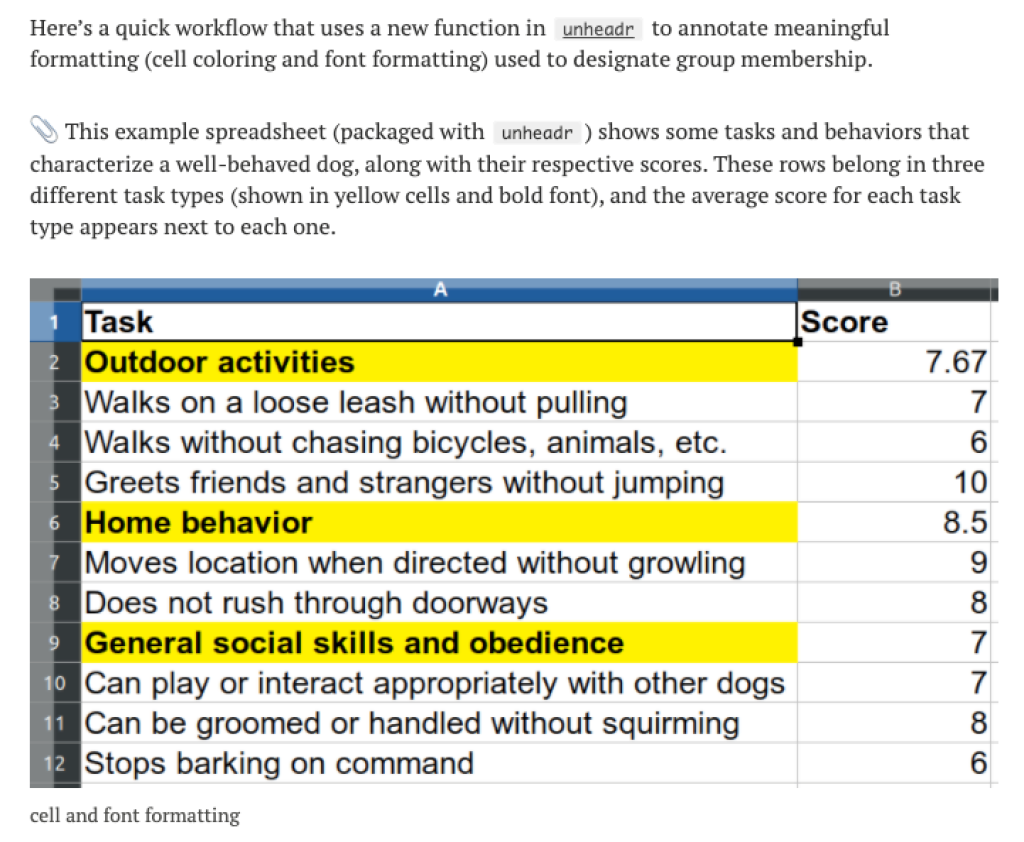
A recent update to the unheadr package also allows you to take spreadsheets where highlighting is used to indicate values (e.g. all cells with red background are in group 1, all cells with blue background are in group 2, etc.). In a blog post describing the update, Luis gives an overview of how this works.
tidycells
In a similar vein, the tidycells package is designed to help you import less than fully clean data. This package is particularly helpful for dealing with spreadsheets that have what should be multiple tables on a single sheet. Something like this:
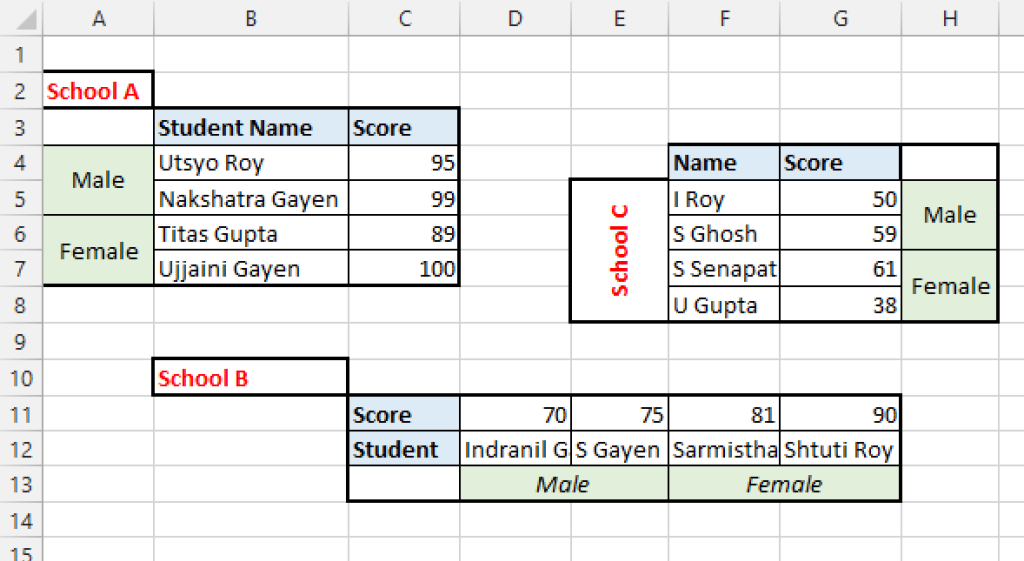
Through what appears to me to be magic, the package converts spreadsheets like this into tidy formats. To read a bit more about the process, check out the package vignette.
unpivotr
The unpivotr package has many of the same features as unheadr and tidycells (one benefit of R being open source is that anyone can design packages so you can choose whichever solution you like best). In particular, the package “deals with non-tabular data, especially from spreadsheets,” with any of these “features”:
Multi-headered hydra
Meaningful formatting
Headers anywhere but at the top of each column
Non-text headers e.g. dates
Other stuff around the table
Several similar tables in one sheet
Sentinel values
Superscript symbols
Meaningful comments
Nested HTML tables
janitor
Once you have your data imported into R using the package of your choice, your work is likely just beginning. This is where the janitor package shines, which author Sam Firke describes on its website:
janitor has simple functions for examining and cleaning dirty data. It was built with beginning and intermediate R users in mind and is optimized for user-friendliness. Advanced R users can already do everything covered here, but with janitor they can do it faster and save their thinking for the fun stuff.
A few functions in particular are extremely helpful for dealing with messy data.
clean_names()allows you to convert data with less than friendly column names into names that are easy to work with. You can see an example in this video from my Fundamentals of R course.
The janitor package also has a function to identify duplicates. The get_dupes() function enables you to “specify the data.frame and the variable combination to search for duplicates and get back the duplicated rows.”
A couple other functions from the janitor package worth mentioning:
remove_empty(): “Removes all rows and/or columns from a data.frame or matrix that are composed entirely of NA values.”excel_numeric_to_date(): “Converts numbers like 42370 into date values like 2016-01-01.” If you’ve ever imported data with dates from Excel, you’ve likely seen it converted into numeric values. This function is a lifesaver!
tidyr
The tidyr package offers a wide range of functions to wrangle your data into tidy format. The most well-known functions enable you to reshape your data, going from wide to long and vice versa, a common and important step in tidying data. Until recently, the functions to do this were gather()(wide to long) and spread() (long to wide), but the recent introduction of pivot_longer() and pivot_wider() has changed things up (for the better: these new functions are much more intuitive than their older counterparts). To learn about reshaping your data using these functions, check out the vignette on pivoting or these tutorials:
The tutorials for the pivot_longer() and pivot_wider() functions in the {tidyr} package are now coming thick and fast!
— R for the Rest of Us (@rfortherest) November 20, 2019
Pivoting tidily by @ucfagls: https://t.co/y91gYehKra
How to reshape data with tidyr’s new pivot functions by @sharon000: https://t.co/whtFxiFKiP pic.twitter.com/aW0xPgHImj
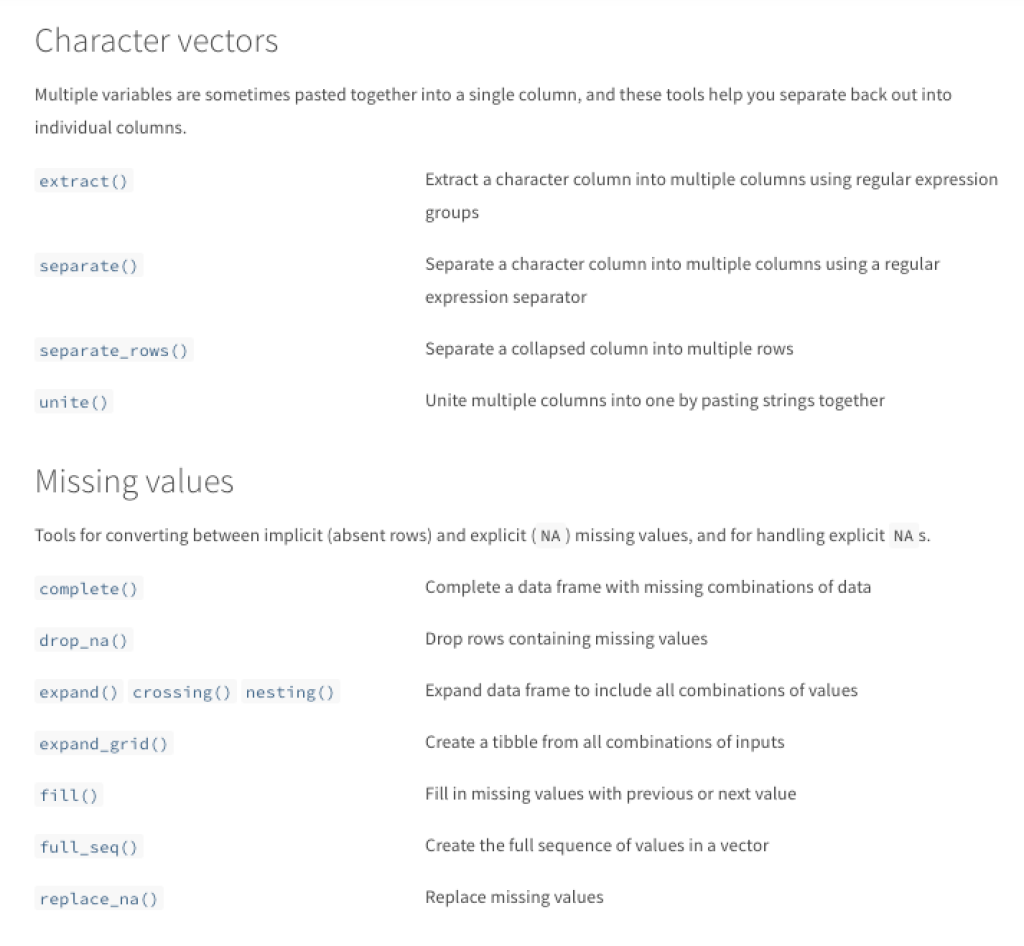
The tidyr package has a number of other functions that you’ll need to use as you work with messy data of various sorts. The reference page on the tidyr website, which lists all functions in the package, groups them by purpose. The functions in character vectors and missing values sections are particularly helpful when you receive messy data in spreadsheets.
Have Empathy for Others
Those of us who work with data are professionals. Working with data is one of the main skills for which we are hired. These are not skills that come naturally, and so it should not be surprising that those without our training and experience provide data we consider to be "messy."
Some data analysts look down on others. But this is both nonsensical (we don't expect non-surgeons to bust out a scalpel and perform surgery) and counterproductive (complaining about people providing messy data can lead them to not want to work with us).
When people use highlighting in spreadsheets, for example, they are not doing anything wrong. They are working with their data in a way that makes most sense to them.
When people use highlighting in spreadsheets, for example, they are not doing anything wrong. They are working with their data in a way that makes most sense to them. That this method of working with data doesn't lend itself to the types of analysis we do is a secondary consideration (if it is a consideration at all). The type of tidy data that many of us like to work with works for our purposes, but it would likely be hard for others to make sense of. Different horses for different courses.
So, when working with others providing data in spreadsheets, treat them respectfully. If you want to receive your data in a certain way, educate them on best practices for doing so. And, when you have no choice but to deal with messy data, rest comfortably in the knowledge that there is an R package that can help you.
Read More
Still want more? Ok, here you go:
Gina Reynolds has a great data cleaning flipbook with examples of several of the packages listed above.
Crystal Lewis gave a presentation to R-Ladies St. Louis recently on the topic of cleaning data in R. Her slides and materials are available on GitHub.
Sharla Gelfand has written and spoken about cleaning data. She has written about cleaning Toronto Transit Commission data and given a talk about cleaning Canadian federal election data.
Sign up for the newsletter
Get blog posts like this delivered straight to your inbox.

You need to be signed-in to comment on this post. Login.