How to Evaluate R Packages
One of the challenges for people learning R is this: there are often many ways to accomplish the same goal. This is, of course, also a benefit (if you don't like the first approach, just try another one!). But when you're just starting out and don't have much experience with R, multiple solutions to a problem are more likely to be confusing than helpful. This dilemma often shows up in one of the most common questions I get from new R users, which I tweeted about last year.
Question I get asked a lot by new #rstats users: how do you identify which packages are high quality? Curious how others answer this.
— David Keyes (@dgkeyes) August 22, 2019
The responses to my tweet were thoughtful, as always with the R community. Here's a summary of my thoughts, supported by what people helpfully shared. I'm intentionally focusing on the responses that are most helpful for new R users, the main folks I work with.
Is this package designed to be user friendly?
The first thing I think about when I look at a package is how user friendly it is. This is why I always try to use tidyverse packages first. Given the range of packages that are part of the tidyverse, it is quite likely that one of them does what you need. And, given the focus on naming functions with English verbs (e.g. filter()), learning a tidyverse package is likely to be easier for newbies than packages without this focus on user friendliness.
If there isn't a core tidyverse package to do what I need, I then look for packages that do what I need while working with the tidyverse. Because the tidyverse collection of packages all follow a consistent style, the grammar that you learn working with the tidyverse will translate to any package that works with it. For example, because all tidyverse packages have the data frame as their first argument, it makes it possible to use the pipe to create a series of functions in one pipeline of code (for example, you might filter to only include survey respondents over 50, then calculate average height by various age groups). Choosing a package that is tidyverse-friendly enables you to work in this way, knowing that the package will play nicely with everything else you're using.
Is there an organization behind this package?
The tidyverse packages also benefit from having a team of talented developers (the folks at RStudio) working full-time on them. This organizational infrastructure makes it possible to create packages that follow a consistent structure, and ensure that the packages will be around for the long term.
Another organization helping to develop R packages is rOpenSci. This organization supports the development of packages that benefit open science. rOpenSci packages go through a code review process that ensures they meet quality standards. RStudio's Alison Hill recommended rOpenSci packages in response to my original tweet.
I guess I usually go by "how much is this package made for users?" If I cannot find a pkgdown site or a vignette or a README at a minimum, then I assume it is not made for widespread external consumption. This is why @rOpenSci packages always get my 💕
— Alison Hill (@apreshill) August 22, 2019
Does this package have clear documentation?
In her response to me, Alison Hill spoke positively of rOpenSci packages because they have a vignette and README. Let's look at each of these in turn.
The README that Alison Hill mentions is a broad overview of the package that typically has a few parts (these are from Hadley Wickham and Jenny Bryan's R Packages book):
1. A paragraph that describes the high-level purpose of the package.
2. An example that shows how to use the package to solve a simple problem.
3. Installation instructions, giving code that can be copied and pasted into R.
4. An overview that describes the main components of the package. For more complex packages, this will point to vignettes for more details.
Hadley Wickham and Jenny Bryan describe vignettes as a “long-form guide” to packages. As they put it:
A vignette is like a book chapter or an academic paper: it can describe the problem that your package is designed to solve, and then show the reader how to solve it.
Vignettes walk the user through how they might use the package. They provide clear demonstration of how to use same part of the package. A great example is the pivoting vignette from the tidyr package, which demonstrates how to reshape data.
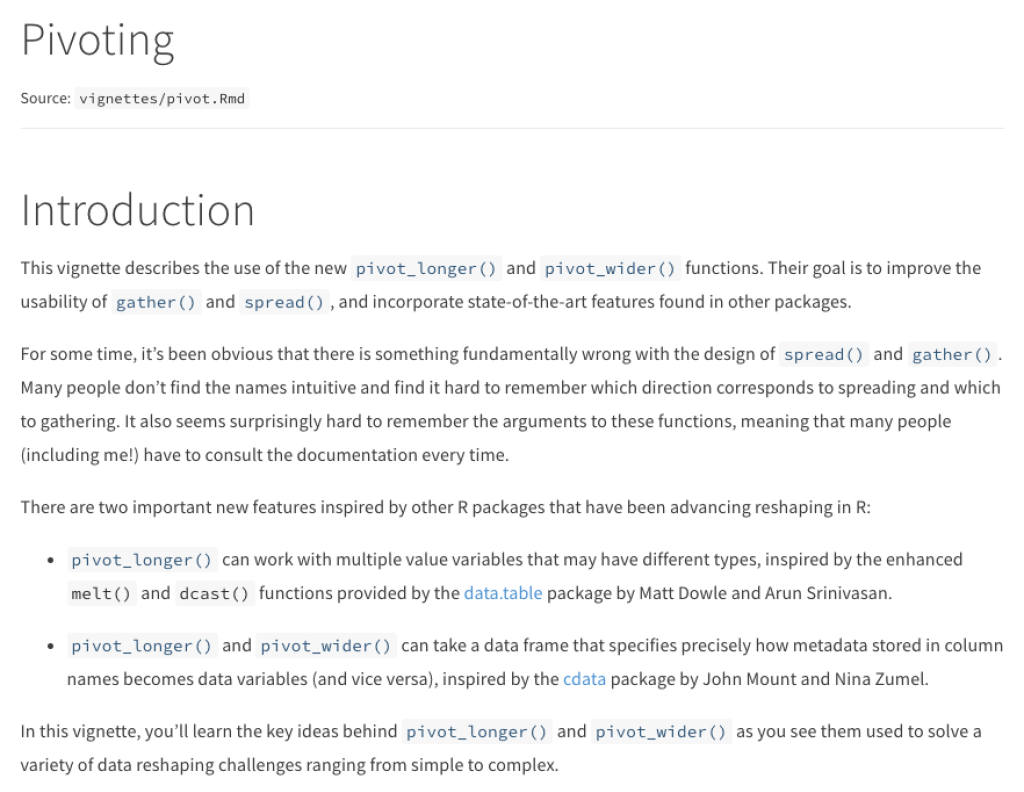
Having at least one vignette (many packages have several) is a good indication that the package developer cares about making the package accessible to new users.
Having at least one vignette (many packages have several) is a good indication that the package developer cares about making the package accessible to new users.
Many packages today have websites that display the README, vignettes, and documentation of how each function in the package work. These are typically built using a package called pkgdown (yes, a package to display information about packages).
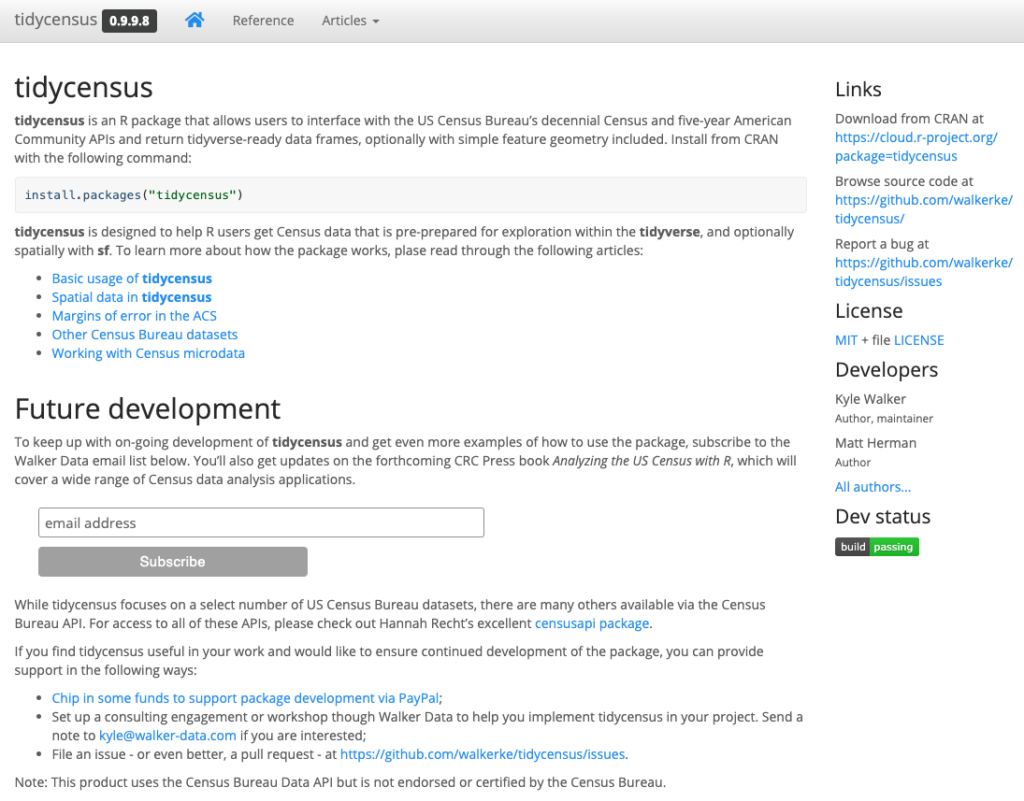
Having a pkgdown site, something Alison mentions, is, again, an indicator that the package developer has taken the time to document and share information about how her package works.
When was this package most recently updated?
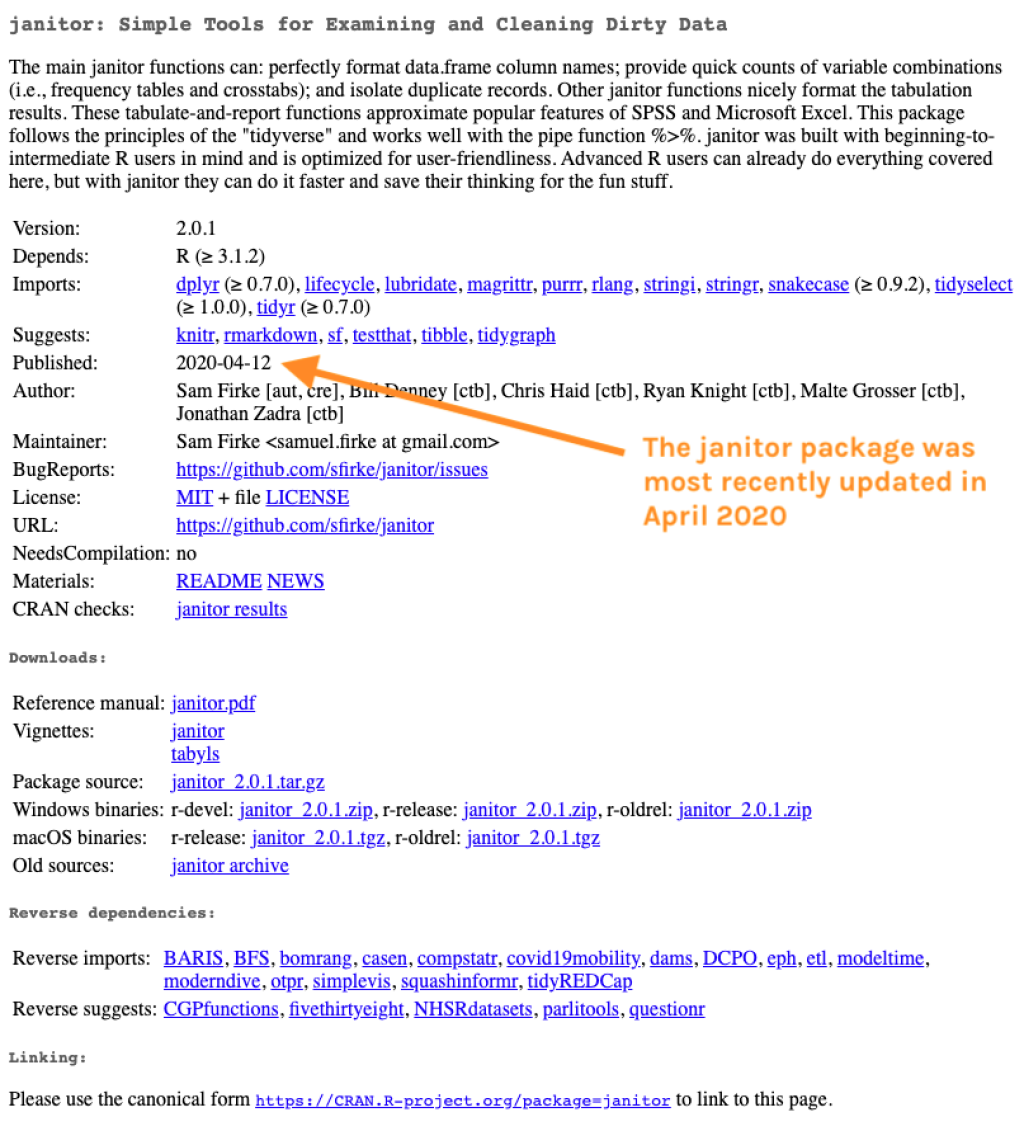
There are a few ways to check when packages were most recently updated. If a package has been released on The Comprehensive R Archive Network (aka CRAN), which means you can install it using the install.packages() function, a Google search of the package name will typically bring up its page on the CRAN website. From there, you can look at the published date, which shows when the package was most recently updated (the name technically refers to when that version of the package was published, which is why it’s called published and not last updated or something similar).
ome packages are not released on CRAN. You can often find them on GitHub. If you’re not familiar with GitHub, it is a place where developers share the code they use to develop software. One nice thing about GitHub is that, in addition to the actual code that makes up a package, a lot of metadata about the code is visible. If you Google and get to what’s known as a repository (i.e. a place on GitHub where the code for a single package is stored), there are two places to look to see when the code was most recently updated.
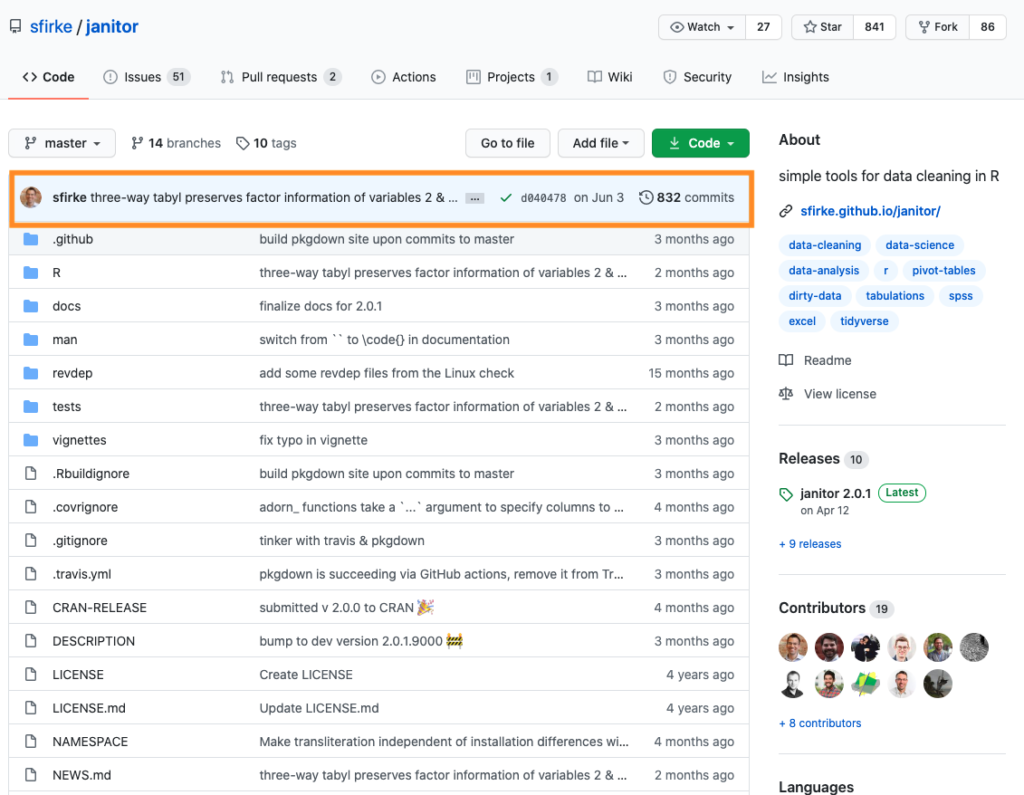
If a package has a releases section on the right, that will tell you when the most recent version of the package was released. Below, for example, you can see that the janitor package was most recently released in April 2020.
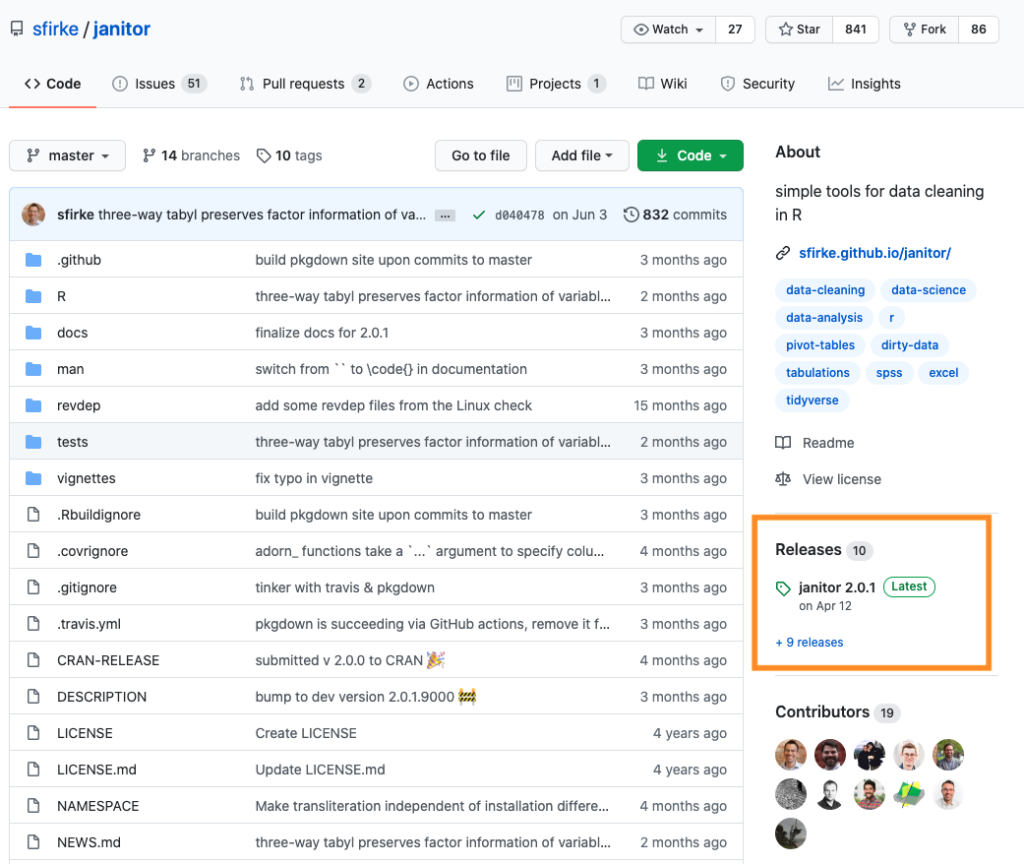
If the package does not use releases, simply look at the top blue row in the main table. This shows the last commit (i.e. the last time the developer made changes to the code). As you can see with janitor this was June 3 (this means that the developer has made changes to the package since the most recent release; these changes will presumably form part of a future release).
Is the package developer responsive to user feedback?
High-quality packages tend to be updated regularly in response to user feedback. The team that develops tidyverse packages is well known for taking user feedback seriously and making changes as a result. It’s why, for exmple, the tidyr package developed the pivot_longer() and pivot_wider() functions after many users talked about how confusing their predecessors gather() and spread() were.
You may have heard a rumour that gather/spread are going away. This is simply not true (they’ll stay around forever) but I am working on better replacements which you can learn about at https://t.co/sU2GzWeBaf. Now is a great time for feedback! #rstats
— Hadley Wickham (@hadleywickham) March 19, 2019
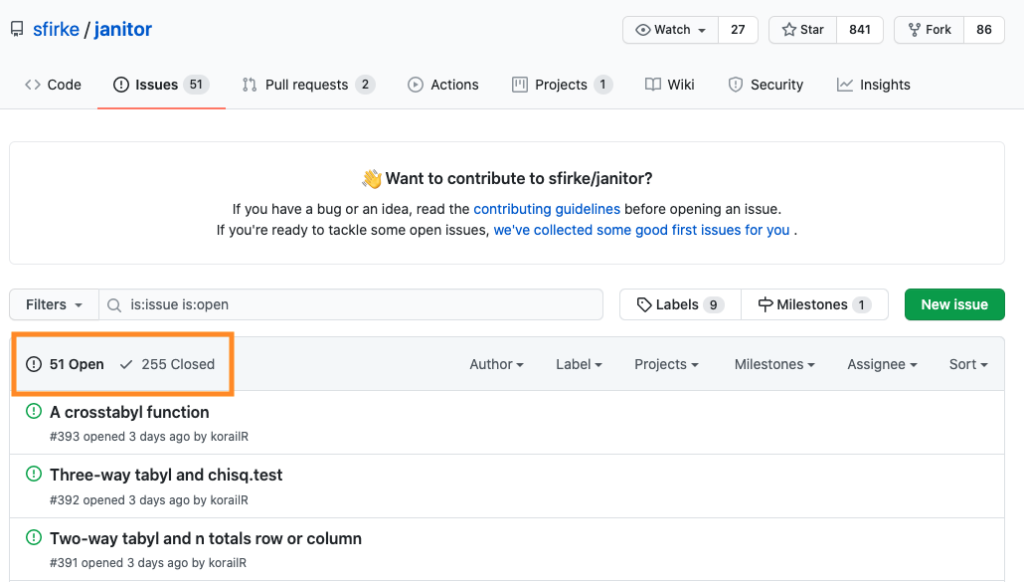
How do you spot a package that has gone stale and whose developer is not responding to users? Within GitHub, there is an issues tab in each repository. Think of issues as to dos. With any public repository, all issues are visible and anyone create new issues. If you take a look at the issues in a GitHub-hosted package, you can see how many open (i.e. pending) and closed (i.e. completed) issues there are (51 and 255 respectively in the screenshot below).
Having a lot of closed issues means that the developer has made changes. Having a lot of open issues means there are requests for changes, either from users or things the developer has added herself. The fact that there are a lot of open issues doesn’t necessarily mean the developer is ignoring feedback — the package may be so popular that a ton of requests come in! But, you can click on any individual issue to see discussion of it. If issues are being submitted and then ignored, there’s a good chance the package is not being actively developed. If issues are being submitted and responded to, that’s a good sign, as Sharon Machlis pointed out.
Response to bug reports is also a useful signal to me.
— Sharon Machlis now at @[email protected] (@sharon000) August 28, 2019
How widely used is this package?
A last, though definitely least important, suggestion: look at how widely used the package is. As Fernando Rodríguez-Sánchez pointed out, the packagemetrics package (developed by rOpenSci) can help with this.
*Authors*, test coverage, continuous integration, last update/commit freq, issues resolution, stars, downloads, reverse dependencies... https://t.co/kjZ060PHqY@ropensci's packagemetrics can help compare all this at once: https://t.co/Ig3tg8V5qd pic.twitter.com/MjW9s1Gehl
— F Rodriguez-Sanchez (@frod_san) August 22, 2019
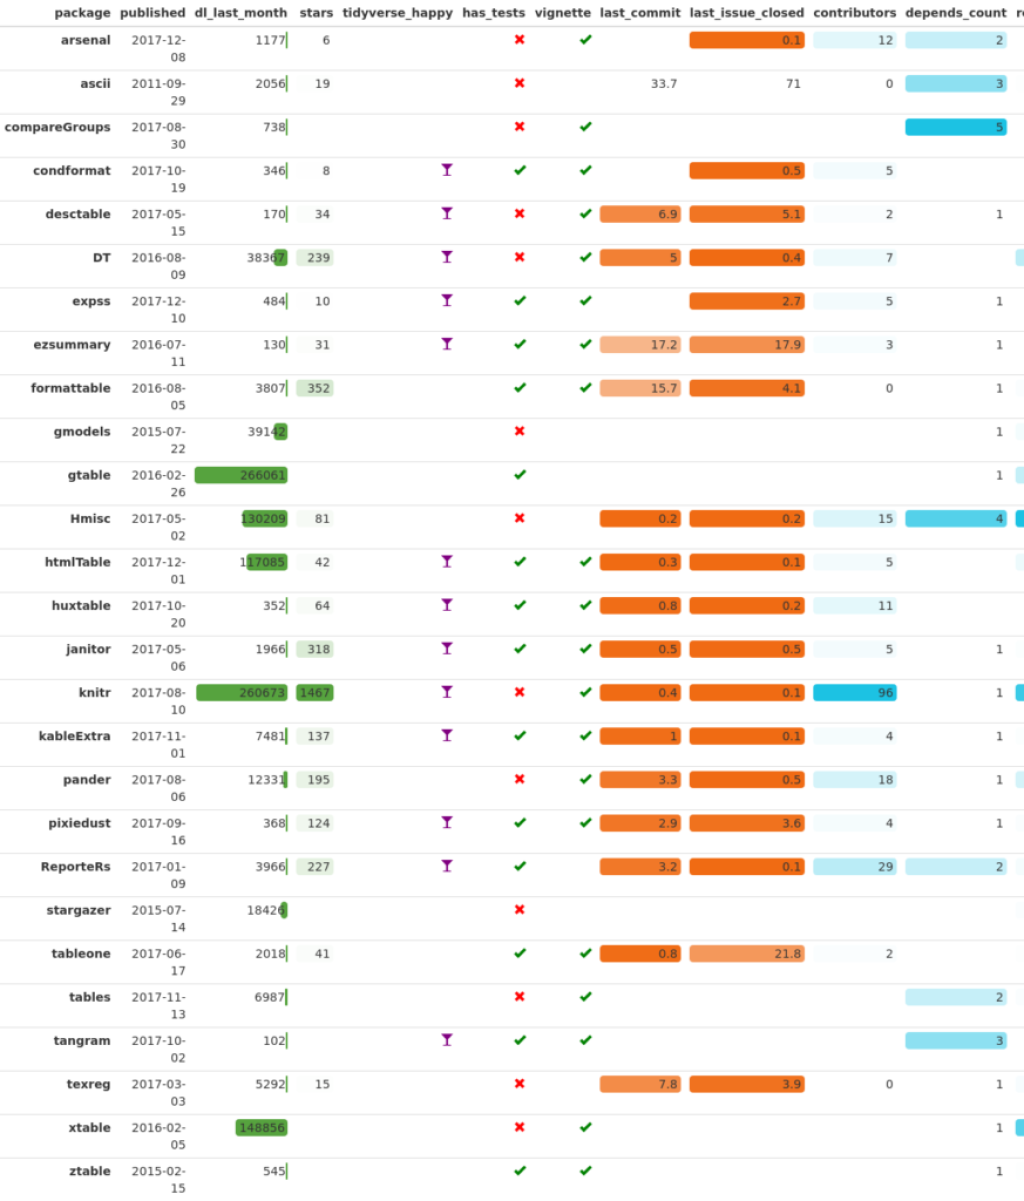
Using the packagemetrics package, you can use the package_list_metrics() function to see information about any package. For example, this output, taken from the packagemetrics README shows details about several table-making packages. In particular, I would focus on two metrics: how many downloads the package has (assuming it is released on CRAN) and how many stars it has on GitHub. These show up in the dl_last_month and stars variables respectively. For both, higher numbers indicate wider use.
Not into using an R package for this? Check out the MetaCRAN website, which has a list of the most downloaded packages on CRAN and packages with most GitHub stars.
Other ways to evaluate R packages
My original tweet prompted a wide variety of responses
A final way to evaluate R packages is something that is probably the one I actually use the most: seeing others I know and trust in the R community post about them (I'm not alone in this). When I see Hadley Wickham, chief scientist at RStudio and the main force behind the tidyverse, post about the gt package, for instance, I know that it's going to be good.
gt = grammar of tables. It aims to do for tables what ggplot2 did for graphics. It’s still early days and tables are surprisingly complicated, but this is a very exciting package by a skilled developer! #rstats https://t.co/138FrCy5th
— Hadley Wickham (@hadleywickham) April 8, 2020
Of course, it's hard to know who to trust when you first start out. My advice? Follow the #rstats hashtag on Twitter. It's where the R community is primarily found. After you've followed #rstats for a few weeks, you'll see who continues to pop up. Follow them and see what they talk about.
Good luck finding packages to help you on your R journey!
Sign up for the newsletter
Get blog posts like this delivered straight to your inbox.

You need to be signed-in to comment on this post. Login.