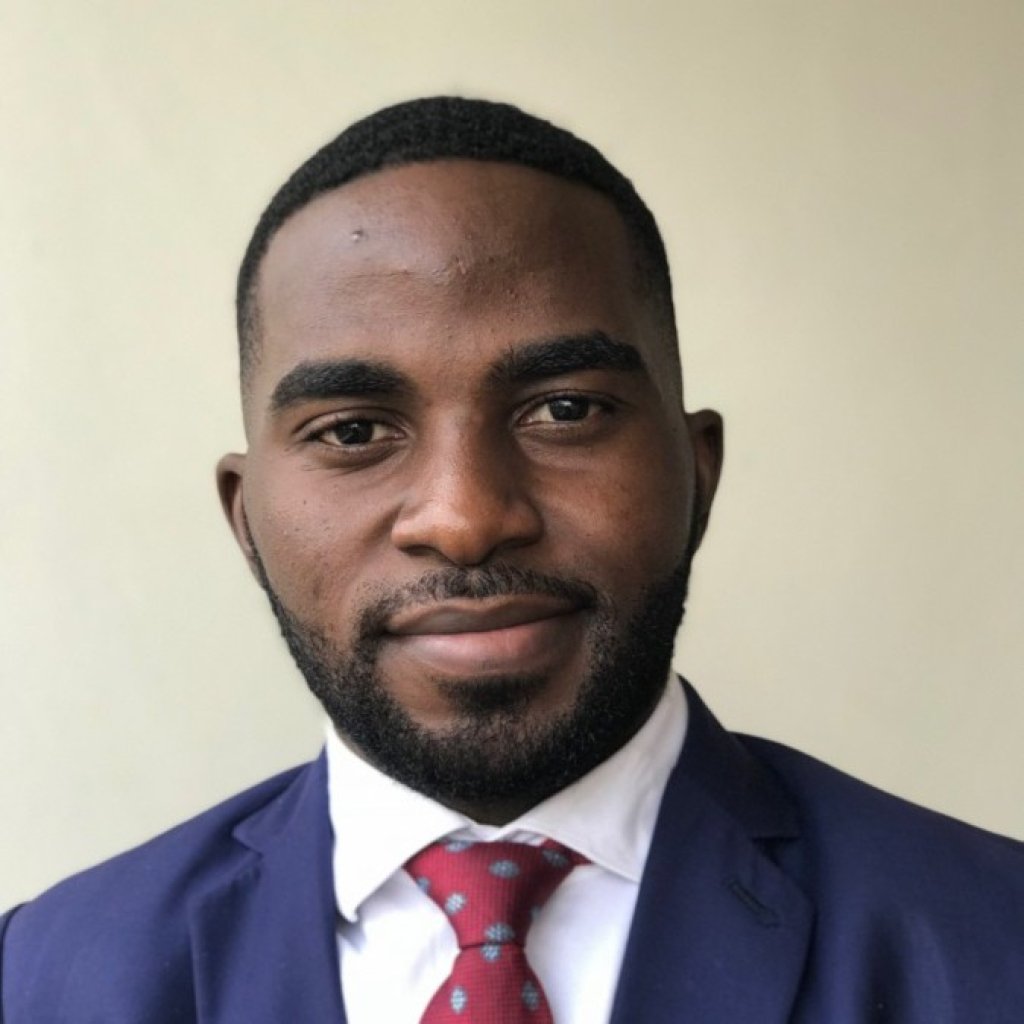
My R Journey: Ibrah Sendide
My name is Ibrah Sendide and I am a PhD candidate at the University of the Witwatersrand, Johannesburg. My work in health economics and outcomes research includes modelling cost effectiveness in health, statistical data analysis and econometric analyses. I recently completed the R in 3 Months program and wanted to share about my experience with it, and with R in general.

When I came across David Keyes' Twitter profile, I saw that he made coding in R less daunting. A click on the link in David's profile took me to the R for the Rest of Us website, where I saw that David emphasizes that his background is in anthropology and he is not a "hard-core quant." Having read all of this, I knew it was time to stop procrastinating and learn R.
As a PhD student in South Africa, I could not afford the R in 3 Months program. However, this did not stop David from doing what he loves to do: helping the rest of us learn R. David made the program affordable for me. Having benefited from David's reservoir of knowledge and coding skills, I now intend to extend his benevolence by teaching others.
Why did you decide to learn R?
Having used Stata for quite a while, I never saw the need to learn R. However, sometimes I found the Stata commands quite complex. In addition, I have developed a passion for coding and data science as a way to diversify my skills during the long COVID lockdown. I realized R was a friendlier program for learning how to code, in addition to being able to run complex regressions and econometric analyses. In particular, I was interested in finding quicker ways of cleaning, analysing data and reporting results in an interactive and reproducible way.
How easy or difficult was learning R? What resources were most helpful?
First, I should say that learning R takes commitment and patience (in my opinion). I found it quite difficult to learn R on my own since I lacked motivation and direction. This was exacerbated by the fact that I was not part of any coding support group in the past, which made it hard to access direct help when stuck.
Fortunately, the R in 3 Months program is tailored to solve all these problems. The program has made learning R less difficult for me, although I trust that it will remain a gradual process until I get to an advanced level. The use of functions to summarize repetitive lines of code saves time, and this was one of my biggest highlights in David's classes. Additionally, David taught me how to convert analyses into quality reports, presentations and dashboards using RMarkdown.
In what ways has learning R changed your work?
The tidyverse package in R has helped me clean and organize my raw data in a consistent way, especially the tidyr package. I have also found an easier way to manipulate, combine, filter and categorise raw data accordingly, using a pool of straightforward functions such as select(), filter(), group_by(), and mutate() from the dplyr package. The pipe (%>%) function makes makes combining these functions exciting. In addition, the ggplot2 package has enabled me to create interactive data visualizations for a project I am currently working on about the socio-economic impact of and response to the Covid-19 pandemic in the sub-Saharan region.
R has enabled me to explore my data more deeply and take control of my data visualizations. I would highly recommend the R in 3 Months program to anyone who wants to learn R.
Sign up for the newsletter
Get blog posts like this delivered straight to your inbox.
You need to be signed-in to comment on this post. Login.