What's New in R: March 11, 2024
Welcome to this week’s edition of What’s New in R! This week, we’re featuring a new version of Quarto, a new-to-me package for geocoding, and a package to ensure your plots are accessible to all. Let’s dive in!
Quarto 1.4
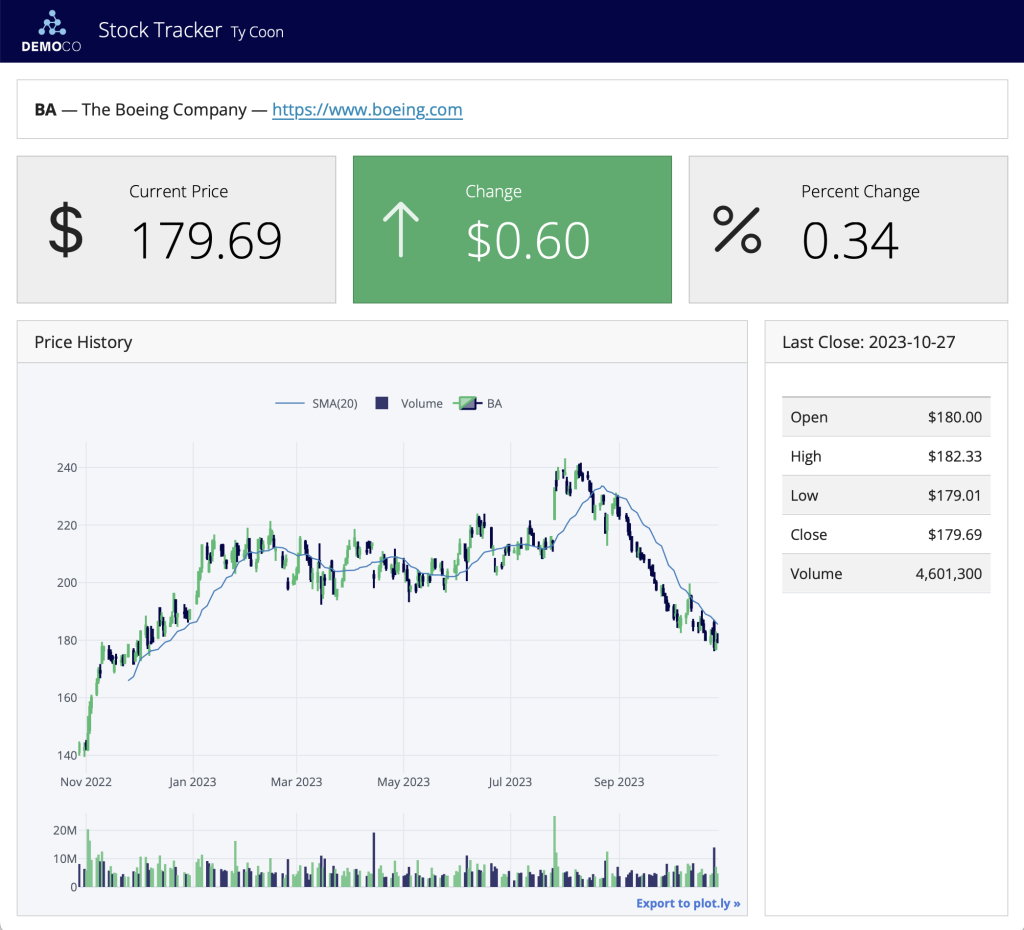
Quarto 1.4 is out. The headline new features are dashboards and PDFs made with the new typst format. If you’ve used the {flexdashboard} package to make dashboards in R Markdown, you’ve probably been waiting for the equivalent functionality in Quarto. It’s now here! And if you want to make PDFs that look good (something we do a LOT in our consulting work) but don’t want to mess around with LaTeX (I don’t blame you), you’ll be happy to learn about the new typst format for formatting PDF documents in Quarto.
{arcgeocoder} package
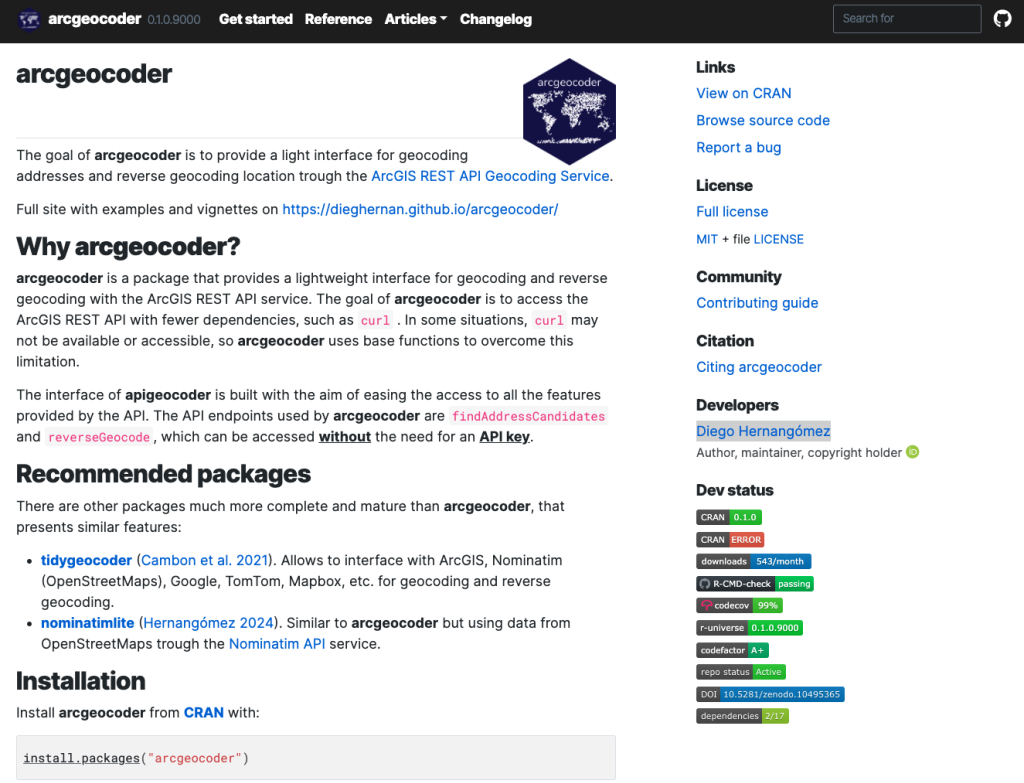
This is very much in the new-to-me category of what’s new in R. If you have addresses and want to put them on a map, you need to geocode them (i.e. turn addresses into longitude and latitude). There are several packages for this (on the recommendation of Charlie Hadley, instructor on Mapping with R, I personally tend to use {tidygeocoder}), including {arcgeocoder}, developed by Diego Hernangómez. If you already work within the ArcGIS universe and have access to an API key, this package should be helpful to you.
{Ra11y}: A collection of accessibilty features for ggplot2 charts
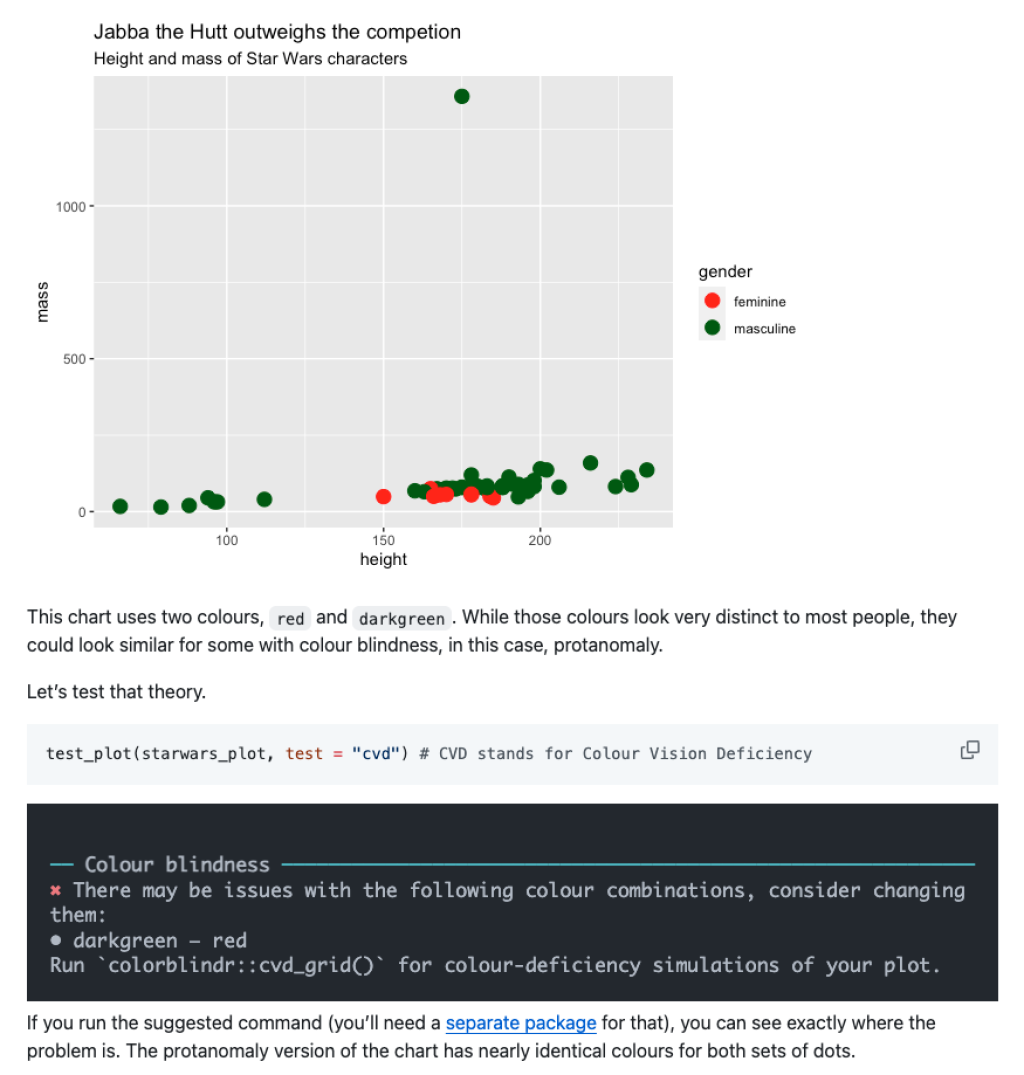
There are many things to consider when making plots accessible. This package by Nicu Calcea has some functions to handle some of the most important things, including checking color blindness accessibility and adding alt text.
If you enjoyed this issue of What’s New In R, please share it with a friend! And if they want to get What’s New in R directly in their inbox, they can sign up on the R for the Rest of Us website.
Got any ideas for resources I should feature in future issues of What’s New in R? Leave a comment below!
Sign up for the newsletter
Get blog posts like this delivered straight to your inbox.

You need to be signed-in to comment on this post. Login.