What's New in R: April 1, 2024
Welcome to this week’s edition of What’s New in R! This week, we’re featuring tips to make interactive data viz without Shiny, recordings of talks from one of the biggest R events of the years, and some great materials on Quarto. Let’s dive in!
Creating interactive visualizations with {ggiraph} (with or without Shiny)
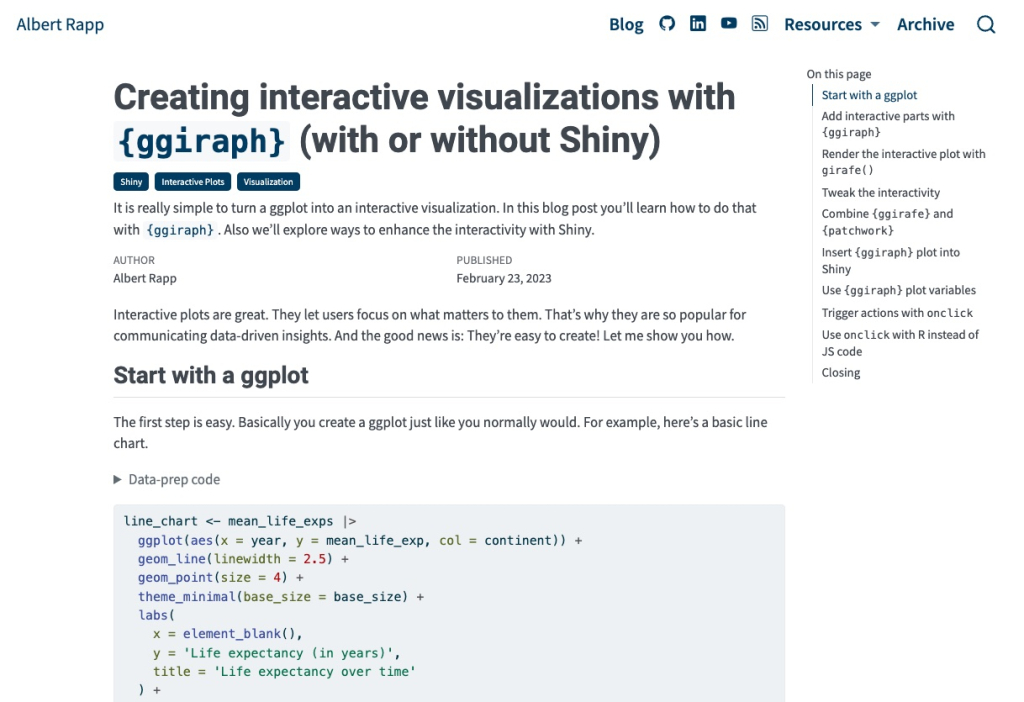
When people think interactive data viz in R, they often think Shiny. While Shiny can be great in certain cases, it’s not always necessary to make your charts interactive. In this blog post by Albert Rapp, he shows how you can use the {ggiraph} package to add interactivity, both using Shiny and without it.
posit::conf(2023) talks
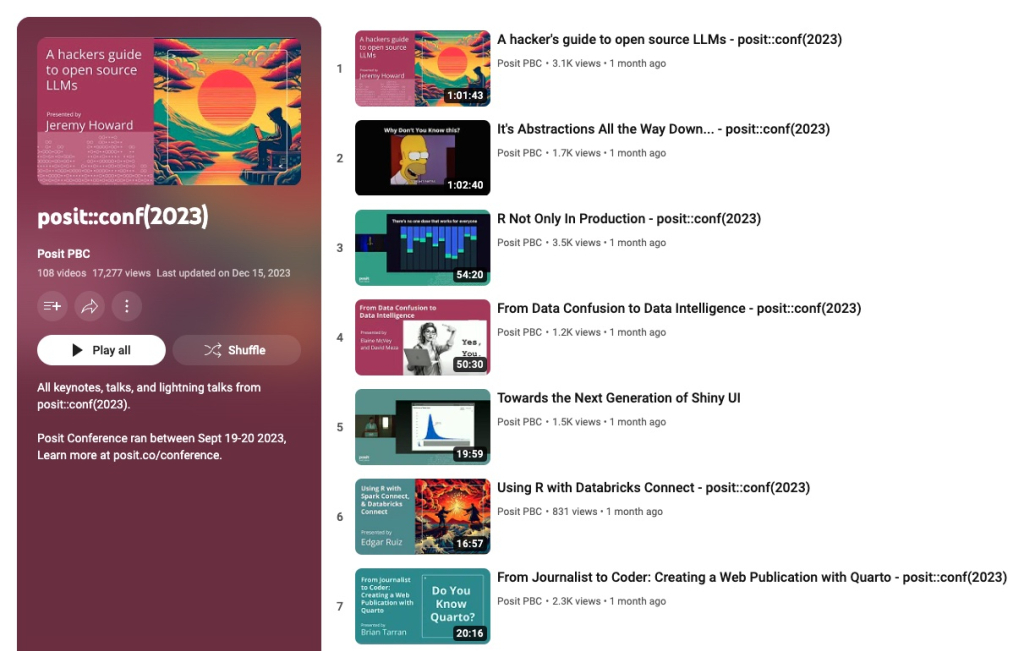
One of the biggest events in the R world is posit::conf. The annual conference put on by Posit (makers of RStudio Desktop and developers of the tidyverse) brings together R users from across disciplines to share knowledge. Posit has posted the recordings of all talks from last year’s conference on YouTube. No matter your background or what you do with R, you’ll definitely find a few talks that will teach you something new.
Quarto for Scientists
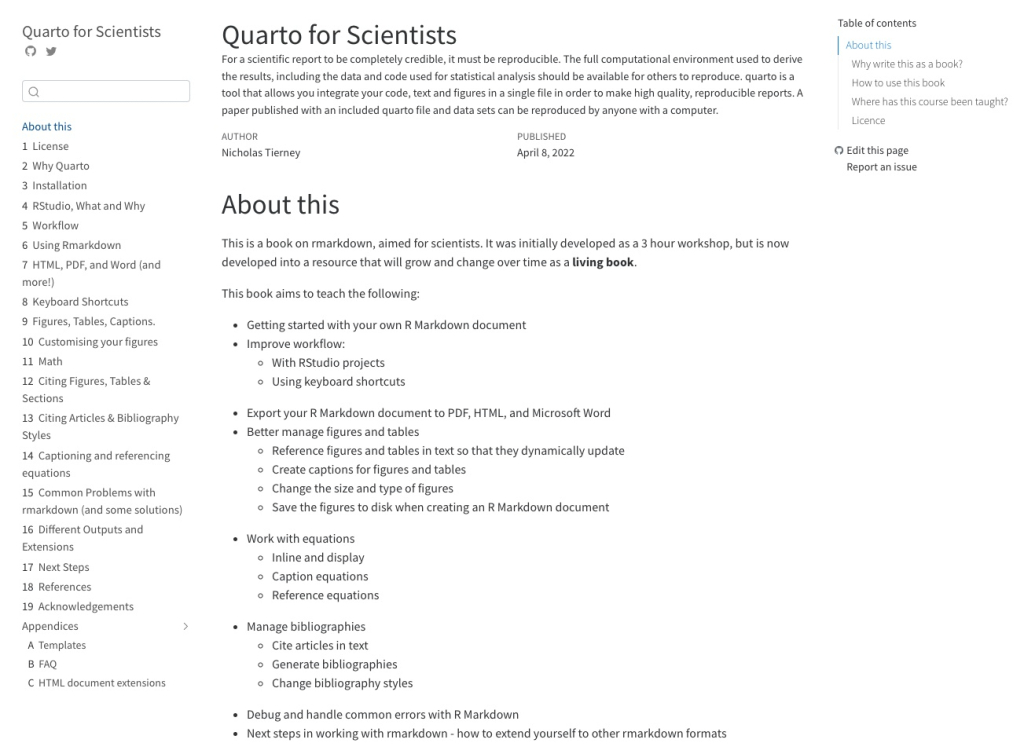
Over the years, I’ve pointed many people to the materials from Nick Tierney’s RMarkdown for Scientists workshop. Nick is now updating the materials to use Quarto. The new materials, called Quarto for Scientists, cover the same concepts in the same, easy-to-follow fashion. If you want to start using Quarto or want to learn more about it, it’s a great resource!
If you enjoyed this issue of What’s New In R, please share it with a friend! And if they want to get What’s New in R directly in their inbox, they can sign up on the R for the Rest of Us website.
Got any ideas for resources I should feature in future issues of What’s New in R? Please leave a comment below!
Sign up for the newsletter
Get blog posts like this delivered straight to your inbox.

You need to be signed-in to comment on this post. Login.