What’s New in R: July 1, 2024
Welcome to this week’s edition of What’s New in R! This week, we’re featuring a tutorial on combining a map and bar chart, a case study of scraping data, and an overview of RStudio shortcuts and settings. Let’s dive in!
Choropleth Map with Bar Chart in R
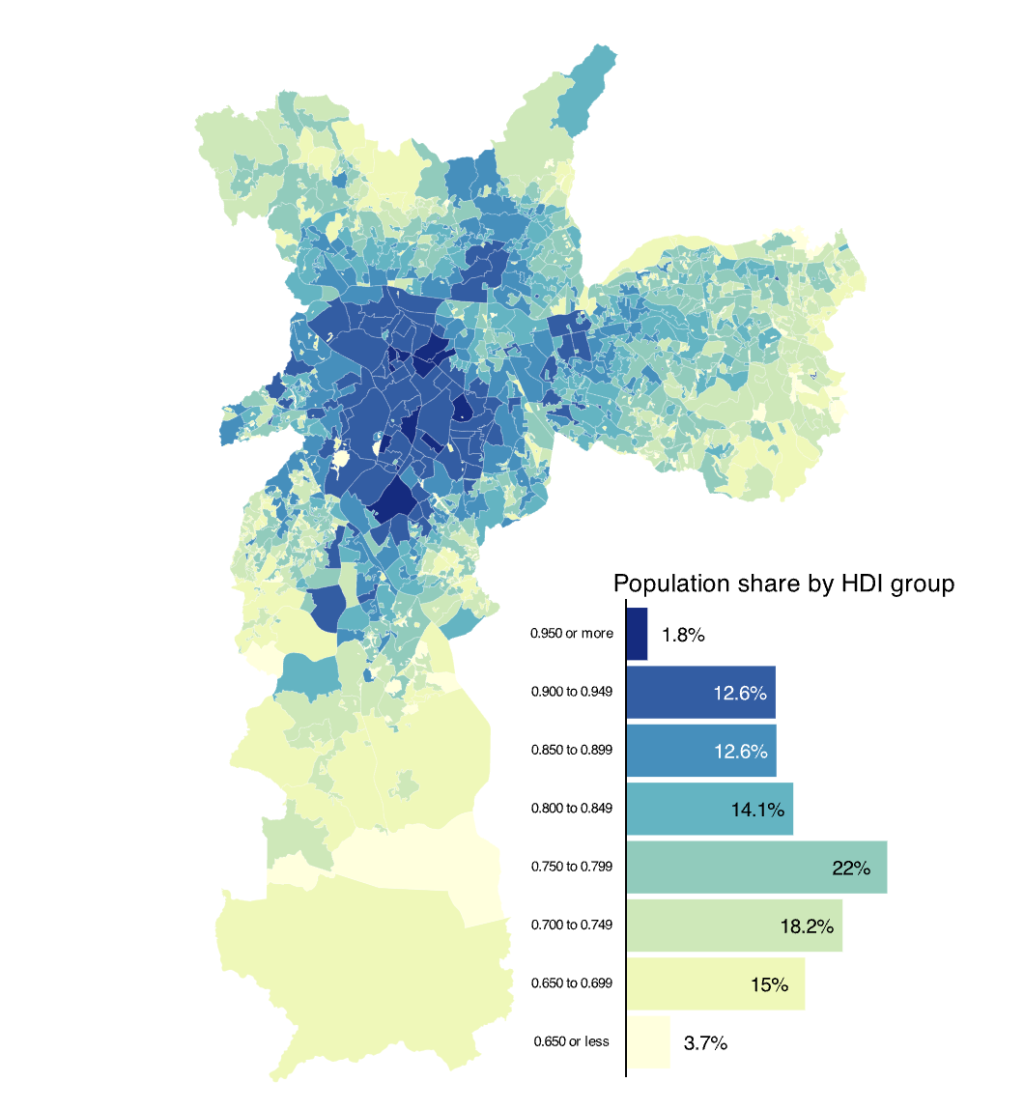
This tutorial on the R Graph Gallery website shows two things: 1) how to make a choropleth map with {ggplot2}, 2) how to combine a map and a bar chart using the {patchwork} package. If you ever need to do either (or both) of these things, check it out!
Introduction to web scraping of judicial data in R
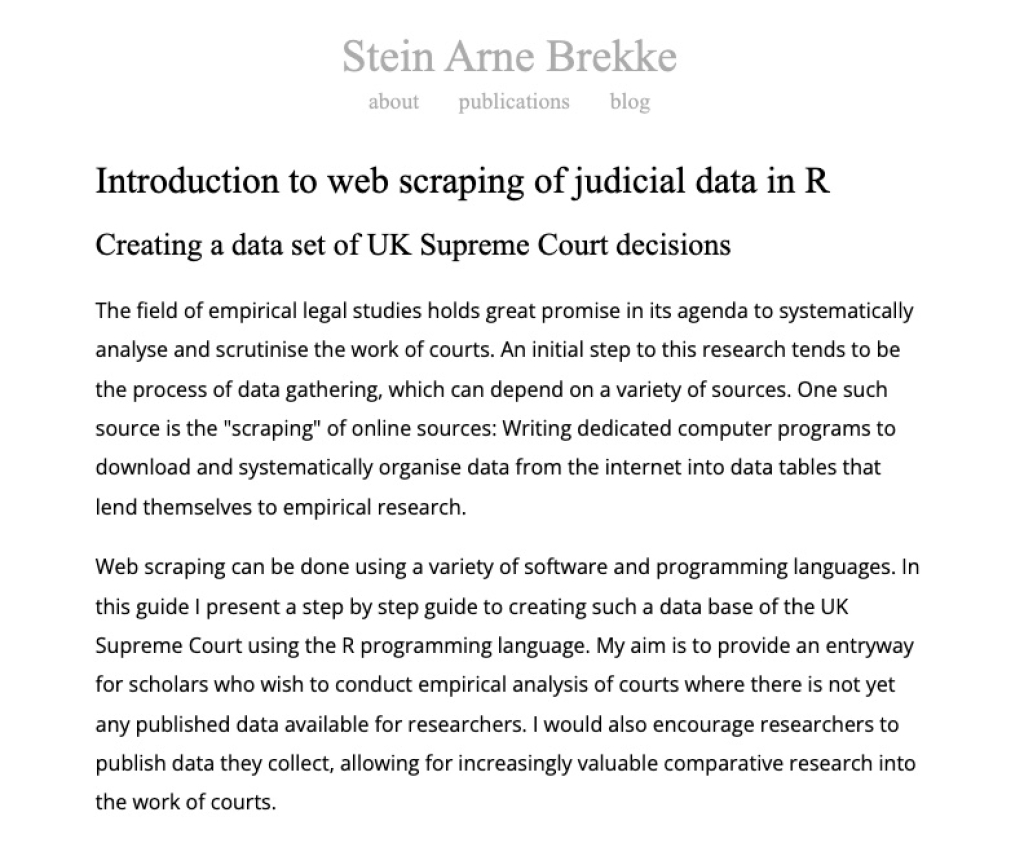
It would be nice if data always came in easy to use formats. It usually doesn’t. One of the worst “formats” of data is data that lives on webpages. If you ever need to, say, grab data from a government website that just lives in HTML tables, you’ve probably thought about learning to scrape data with R. R has several packages to help you with web scraping, and in this blog post by Stein Arne Brekke, you can see a case study of how to use them.
RStudio Shortcuts and Settings
RStudio has many shortcuts and settings that you can change to make your editing experience meet your needs. In this blog post and video, Albert Rapp shows a few of his favorite. You’ll definitely learn a few that you’ll want to use yourself!
If you enjoyed this issue of What’s New In R, please share it with a friend! And if they want to get What’s New in R directly in their inbox, they can sign up on the R for the Rest of Us website.
Got any ideas for resources I should feature in future issues of What’s New in R? Leave a comment below!
Sign up for the newsletter
Get blog posts like this delivered straight to your inbox.

You need to be signed-in to comment on this post. Login.