What’s New in R: September 3, 2024
Welcome to this week’s edition of What’s New in R! This week, we’re featuring the second edition of a ggplot book, a tutorial on making multi-column tables, and a warning about AI slop websites offering R advice. Let’s dive in!
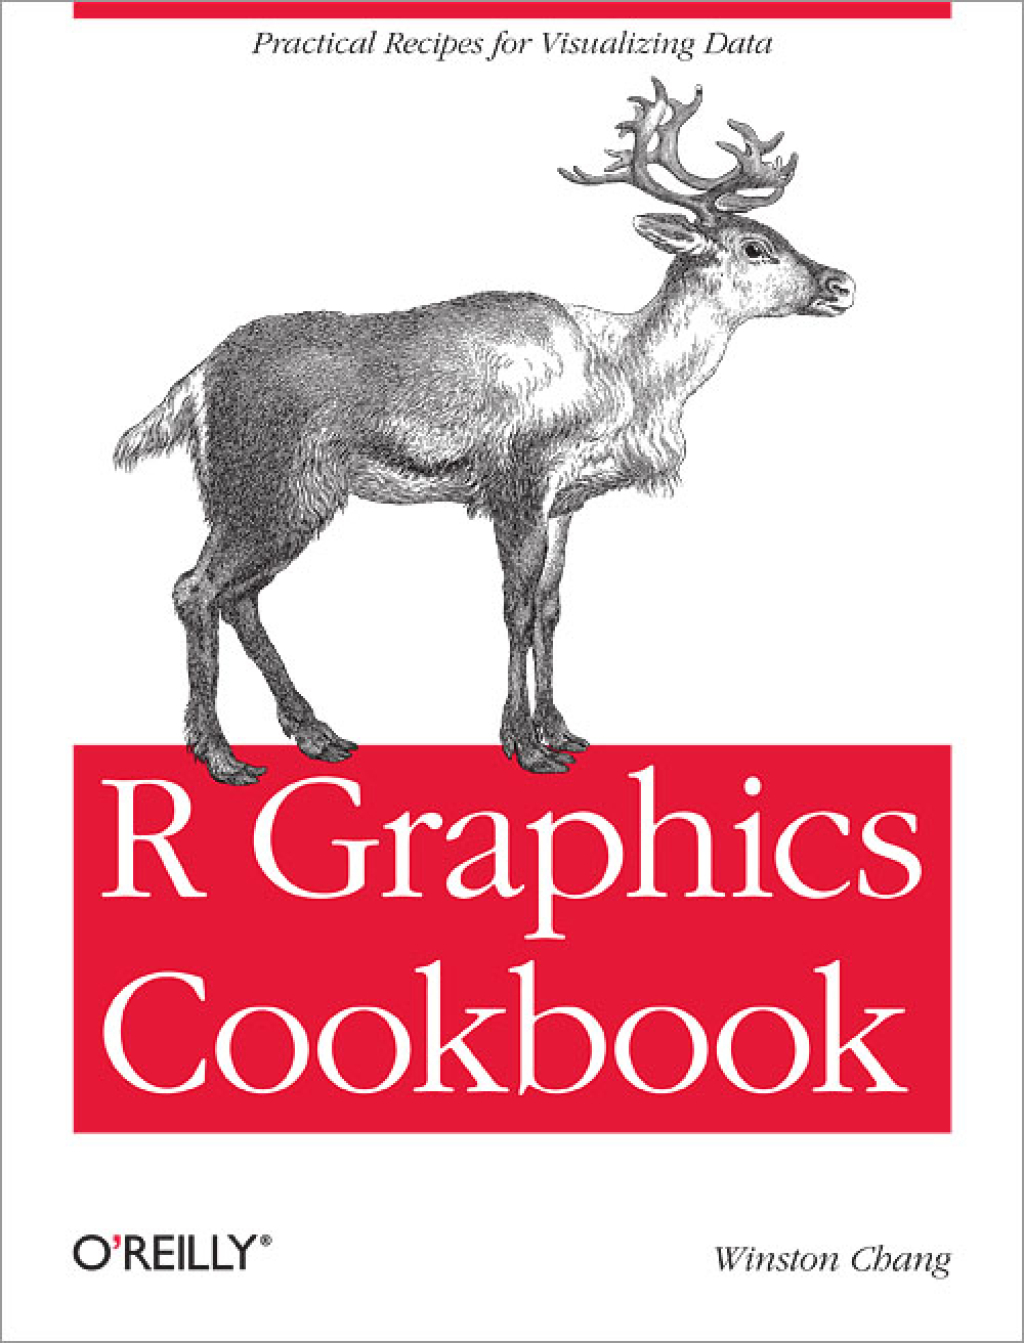
R Graphics Cookbook, 2nd edition
The 2nd edition of this book by Winston Chang was released earlier this year. It’s got recipes that show you how to make a wide variety of charts in ggplot. It’s a great reference.
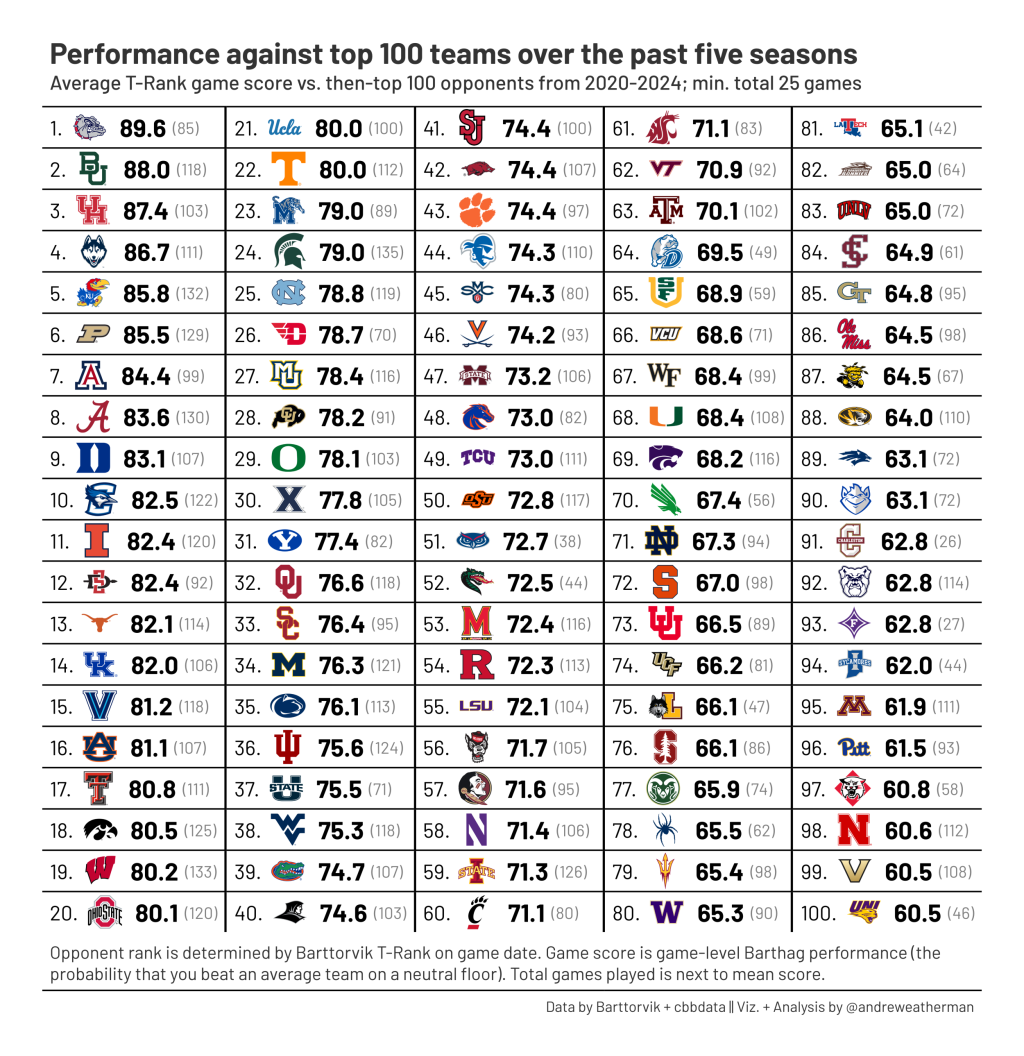
Transform data for easier multi-column tables
This blog post by Andrew Weatherman shows how to use the {gt} package to make multicolumn tables. If you have more horizontal space than vertical space, this is a great way to fit a lot data in a single table.
Shtty R help from shtty AI
If you’ve Googled an R question and ended up on a website whose advice seems … not great, there may be a particular reason: AI. As Matt Dray documents in this blog post, there are serious ethical concerns with these websites (not to mention that their advice may not always be correct). Definitely worth a read.
If you enjoyed this issue of What’s New In R, please share it with a friend! And if they want to get What’s New in R directly in their inbox, they can sign up on the R for the Rest of Us website.
Got any ideas for resources I should feature in future issues of What’s New in R? Leave a comment below!
Sign up for the newsletter
Get blog posts like this delivered straight to your inbox.


You need to be signed-in to comment on this post. Login.