What’s New in R: November 25, 2024
Welcome to this week’s edition of What’s New in R! This week, we’re featuring a guide for transitioning from SAS to R, a fun package for getting started more efficiently on your projects, and a tutorial on creating diamond plots. Let’s dive in!
Converting SAS to R: A Data Scientist’s Guide
Making the switch from SAS to R can be challenging, but this comprehensive guide from Ted Laderas at Fred Hutchinson Cancer Center’s Data Science Lab makes the transition smoother. The guide provides side-by-side comparisons of common data operations in both languages, covering everything from basic data manipulation to statistical analyses.
{froggeR}: Frog-Themed Data Visualizations
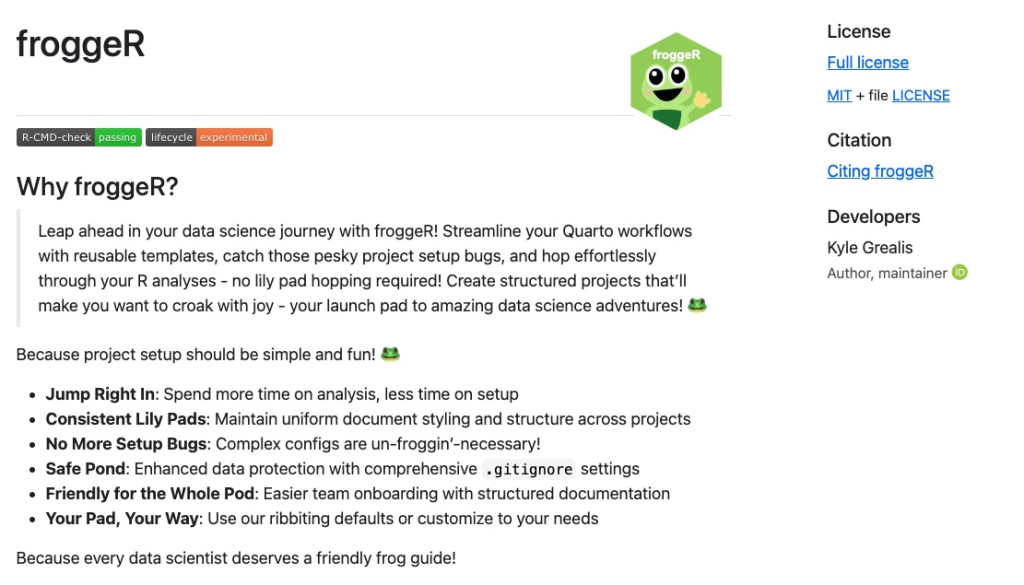
Kyle Grealis has created a delightful R package designed to help you move more quickly with your R projects. It’s got functions for making templated Quarto documents, adjusting styling in Quarto documents, working with git, and more.
Creating Diamond Plots in R
In this detailed tutorial from The F5 newsletter run by Owen Phillips, readers learn how to create eye-catching diamond plots using R. These plots, which are particularly useful for visualizing categorical data with multiple dimensions, offer an innovative way to present your data. The guide provides step-by-step instructions and explains how to customize these plots to match your specific needs.
If you enjoyed this issue of What’s New In R, please share it with a friend! And if they want to get What’s New in R directly in their inbox, they can sign up on the R for the Rest of Us website.
Got any ideas for resources I should feature in future issues of What’s New in R? Leave a comment below!
Sign up for the newsletter
Get blog posts like this delivered straight to your inbox.

You need to be signed-in to comment on this post. Login.