What’s New in R: December 9, 2024
Welcome to this week’s edition of What’s New in R! This week, we’re featuring a tool for generating blog post summaries using AI, a visualization of Greenland’s ice thickness, and a package to replicate Excel formatting in tables made in R. Let’s dive in!
Creating post summaries with AI from Hugging Face
Athanasia Mo Mowinckel shares a clever solution for automating blog post summaries using AI. Using the Hugging Face API and R, she demonstrates how to generate concise summaries of blog posts, which is particularly useful for maintaining SEO-friendly content across a large collection of posts. Even if you don’t need to make SEO-friendly summaries, learning how to summarize text with AI directly from R has a lot of applications.
Greenland ice thickness
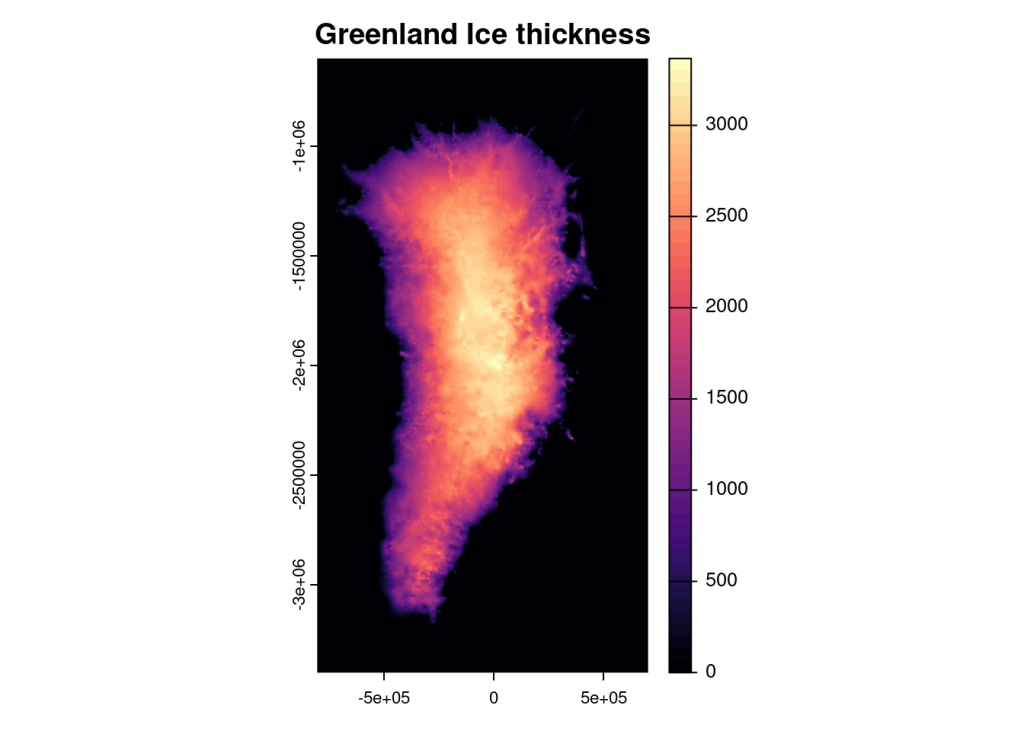
Timothée Giraud presents a fascinating visualization of Greenland’s ice thickness using R. As part of the #30DayMapChallenge’s Arctic theme, this post demonstrates how to work with geographical data to create compelling visualizations. Using data from the National Snow and Ice Data Center, Giraud shows how to create beautiful maps that help us understand the massive ice sheets covering Greenland.
{forgts} package
If you’ve ever wanted to import data from an Excel spreadsheet and recreate its formatting in R, the {forgts} package is for you. Developed by Luis Verde Arregoitia, the package replicates font face and style, cell fill, and cell border properties.
If you enjoyed this issue of What’s New In R, please share it with a friend! And if they want to get What’s New in R directly in their inbox, they can sign up on the R for the Rest of Us website.
Got any ideas for resources I should feature in future issues of What’s New in R? Leave a comment below!
Sign up for the newsletter
Get blog posts like this delivered straight to your inbox.

You need to be signed-in to comment on this post. Login.