What’s New in R: January 21, 2025
Welcome to this week’s edition of What’s New in R! This week, we’re featuring a guide to qualitative data analysis software, making 'comet plots', and a new package for elegant data manipulation. Let’s dive in!
Qualitative software
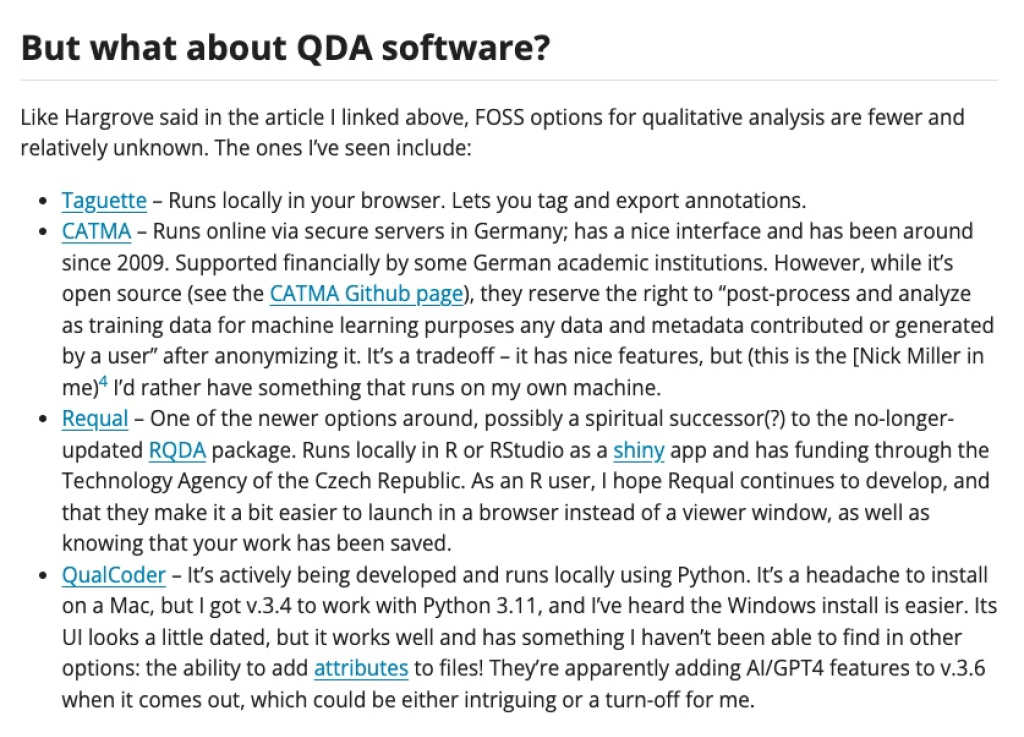
In this comprehensive guide, Nathan Jeffery provides a thoughtful comparison of different software options for qualitative data analysis, exploring both commercial solutions like NVivo and ATLAS.ti, as well as free open-source alternatives, some of which work in R. The article offers valuable insights for researchers looking to make informed decisions about their qualitative analysis toolset.
How To: Comet Plots V2
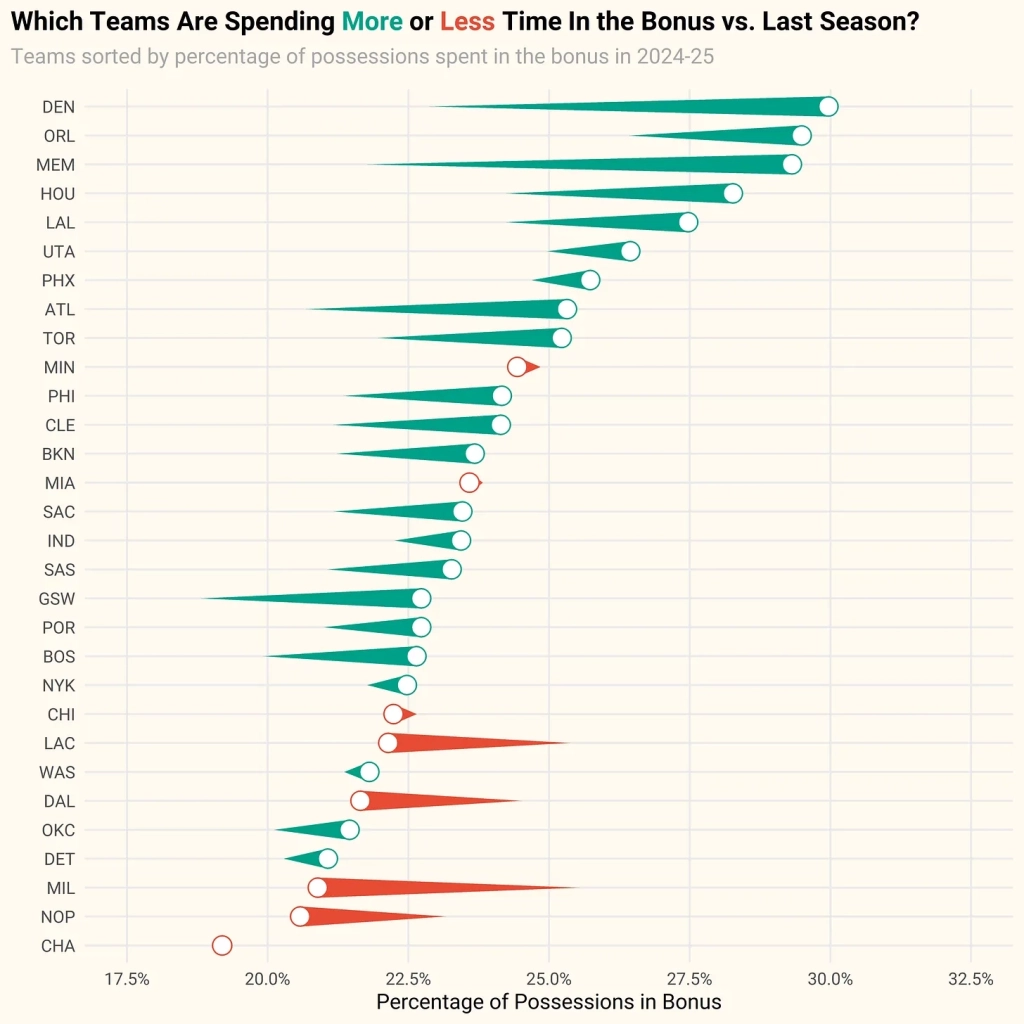
The number of unique data visualizations you can make with ggplot is nearly limitless. In this post, Owen Phillips shows how to make what he calls “comet plots.” They’re an interesting way to show change from one period to another.
{ellmer} package
{ellmer}, developed by Hadley Wickham, Joe Cheng, and the Posit team, is a new package for working with large language models in R. It’s very much in progress, but worth keeping an eye on!
If you enjoyed this issue of What’s New In R, please share it with a friend! And if they want to get What’s New in R directly in their inbox, they can sign up on the R for the Rest of Us website.
Got any ideas for resources I should feature in future issues of What’s New in R? Leave a comment below!
Sign up for the newsletter
Get blog posts like this delivered straight to your inbox.

You need to be signed-in to comment on this post. Login.