What’s New in R: February 10, 2025
Welcome to this week’s edition of What’s New in R! This week, we’re featuring a guide to sign language research in R, a video showing how to make dumbbell plots, and a package for analyzing crime-related datasets. Let’s dive in!
R for Sign Language Research
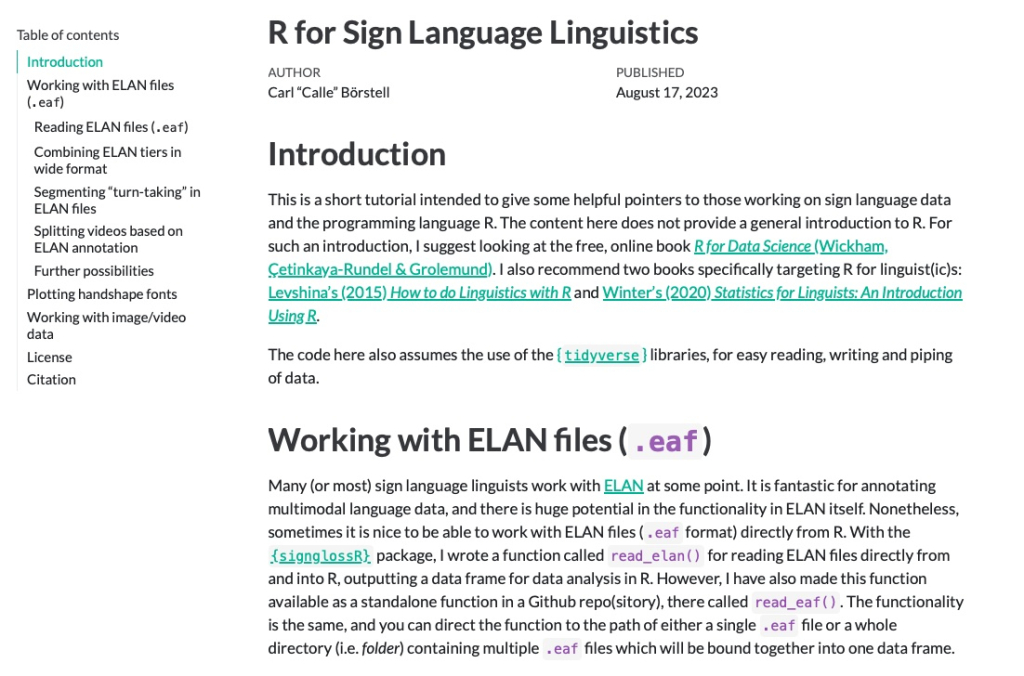
Carl Börstell has created an excellent resource for researchers working with sign language data in R. This comprehensive guide covers everything from data wrangling to visualization specifically tailored for sign language research. The guide includes practical examples and code snippets that make it easier for linguistics researchers to analyze and present their sign language data effectively.
Use dumbbell plots instead of paired bar charts in 130 seconds
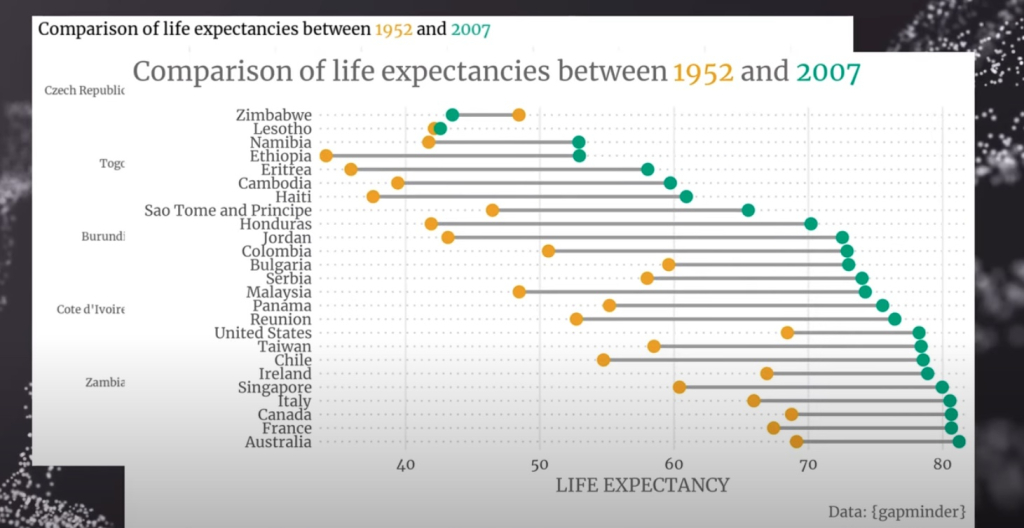
In this YouTube video, Albert Rapp shows an alternative to paired bar charts. Dumbell plots are a great way to show change over time and Albert shows how straightforward it is to make them in ggplot.
{crimedatasets}: A Collection of Crime-Related Datasets
Developed by Renzo Caceres Rossi, the {crimedatasets} package provides a comprehensive collection of crime-related datasets for R users. This package is particularly useful for researchers and analysts working in criminology, law enforcement, or public policy. The datasets included cover various aspects of crime statistics and can be readily used for analysis, visualization, and modeling in R.
If you enjoyed this issue of What’s New In R, please share it with a friend! And if they want to get What’s New in R directly in their inbox, they can sign up on the R for the Rest of Us website.
Got any ideas for resources I should feature in future issues of What’s New in R? Leave a comment below!
Sign up for the newsletter
Get blog posts like this delivered straight to your inbox.

You need to be signed-in to comment on this post. Login.