What’s New in R: February 18, 2025
Welcome to this week’s edition of What’s New in R! This week, we’re featuring a new package for running SAS code alongside R, an inspiring interview with Hadley Wickham, and a tutorial on creating flowcharts in R. Let’s dive in!
{sasquatch}: Create Anthropomorphic Data Visualizations
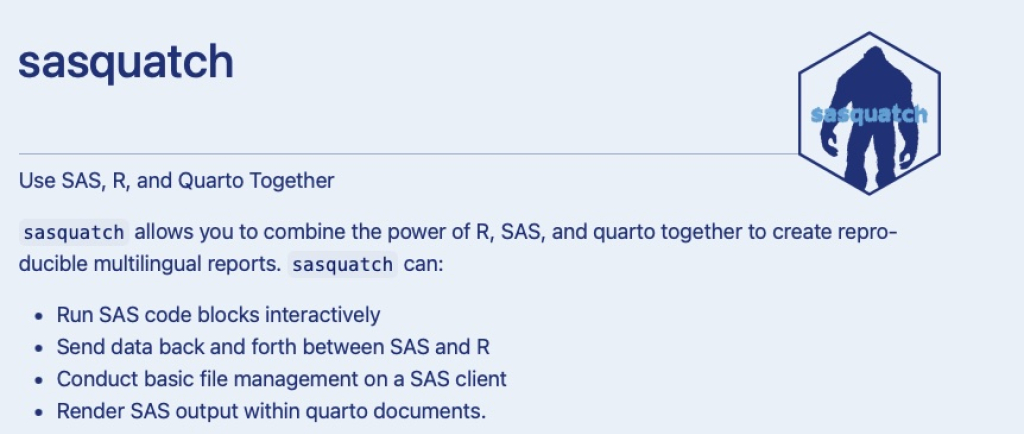
Ryan Zomorrodi has developed a new package that lets you run R code alongside SAS code. You can even combine them when creating Quarto documents.
Focus and feedback in the tidyverse
In this fascinating interview from Open Source Stories, Hadley Wickham shares the journey and philosophy behind the tidyverse, one of R’s most influential collection of packages. He discusses how the project evolved from a set of personal tools to a comprehensive ecosystem that has transformed how people work with data in R. The interview offers valuable insights into open source development and the future of data science tools.
Creating Flowcharts with the {flowchart} Package
Creating flowcharts programmatically in R just got easier with the {flowchart} package. This tutorial demonstrates how to create clear, professional-looking flowcharts directly in R, eliminating the need for external visualization tools. The author provides practical examples and explains how to customize various aspects of your flowcharts, from node shapes to arrow styles and more.
If you enjoyed this issue of What’s New In R, please share it with a friend! And if they want to get What’s New in R directly in their inbox, they can sign up on the R for the Rest of Us website.
Got any ideas for resources I should feature in future issues of What’s New in R? Leave a comment below!
Sign up for the newsletter
Get blog posts like this delivered straight to your inbox.

You need to be signed-in to comment on this post. Login.