What’s New in R: March 31, 2025
Welcome to this week’s edition of What’s New in R! This week, we’re featuring a package for calculating various measures of deprivation, a guide to creating maps with the American Community Survey, and a tutorial on crafting beautiful stack gradients in R. Let’s dive in!
{deprivateR}
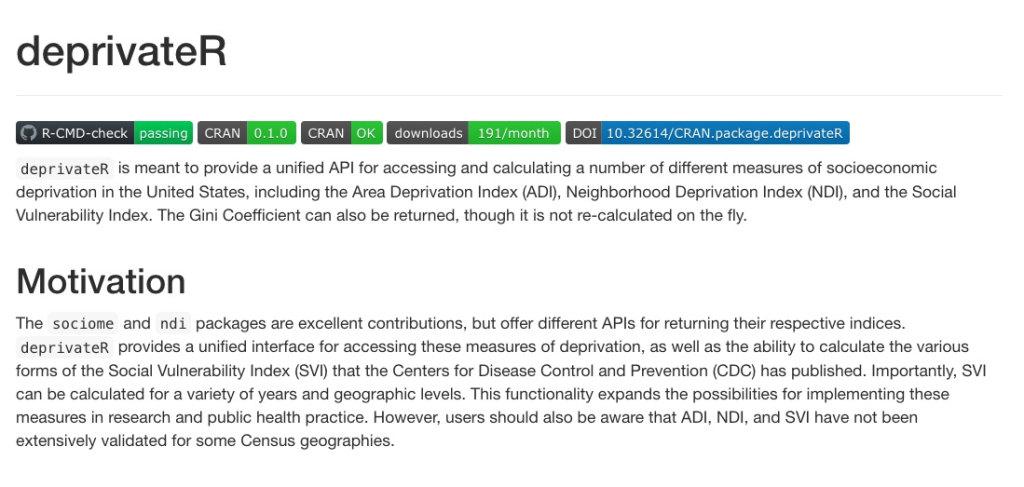
Pfizer has a package called deprivateR, designed to access and calculate various measures of socioeconomic deprivation, “including the Area Deprivation Index (ADI), Neighborhood Deprivation Index (NDI), and the Social Vulnerability Index.”
Mapping water insecurity in R with tidycensus
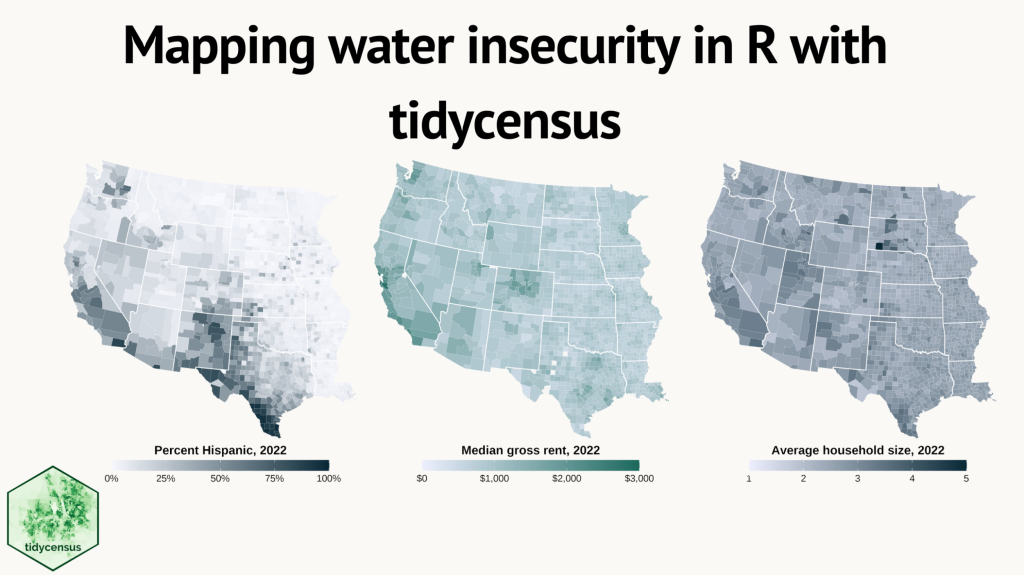
Elmera Azadpour and Cee Nell of The US Geological Survey provides a detailed guide on how to create informative maps using American Community Survey (ACS) data accessed with the {tidycensus} package. This blog post walks you through the process of accessing ACS data and visualizing it with R. In the end, the authors make several beautiful maps to show levels of water insecurity in the United States.
The guide to gradients in R and ggplot2
Gradients are a great way to add visual interest to plots. Commonly used in interactive data viz, you can also add them to static plots in R. This blog post by James Goldie shows you how.
If you enjoyed this issue of What’s New In R, please share it with a friend! And if they want to get What’s New in R directly in their inbox, they can sign up on the R for the Rest of Us website.
Got any ideas for resources I should feature in future issues of What’s New in R? Leave a comment below!
Sign up for the newsletter
Get blog posts like this delivered straight to your inbox.


You need to be signed-in to comment on this post. Login.