What’s New in R: April 28, 2025
Welcome to this week’s edition of What’s New in R! This week, we’re featuring a new R package for accessing elevation data, an overview of what’s new in R 4.5, and a guide to replicating Financial Times-style data visualizations. Let’s dive in!
Introducing {elevationus}: An R Package to Retrieve Elevation Data for U.S. Geographies
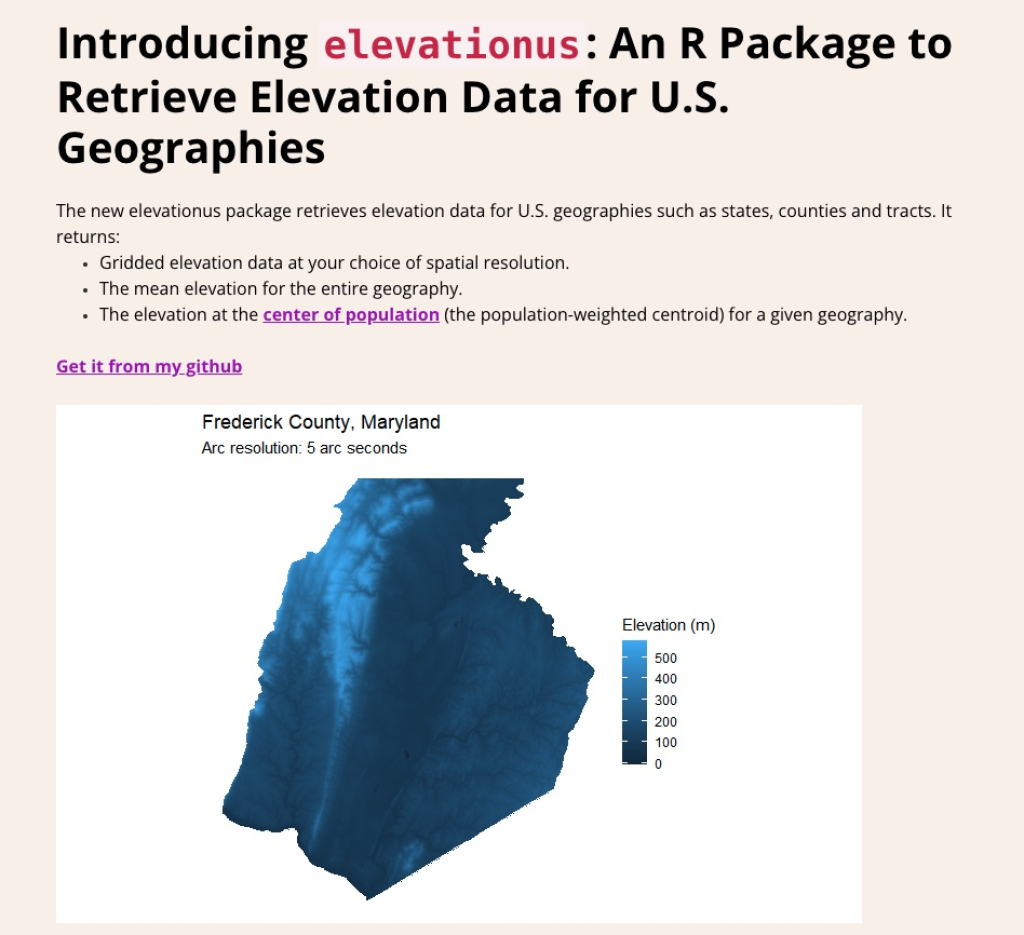
Joey Marshall has released a new R package designed to make retrieving elevation data a breeze. Whether you’re working with geographic data or need elevation details for analysis, this package simplifies the process by connecting to various elevation data sources. This tool can be invaluable for researchers and data scientists who require precise elevation information for their projects.
What’s New in R 4.5.0
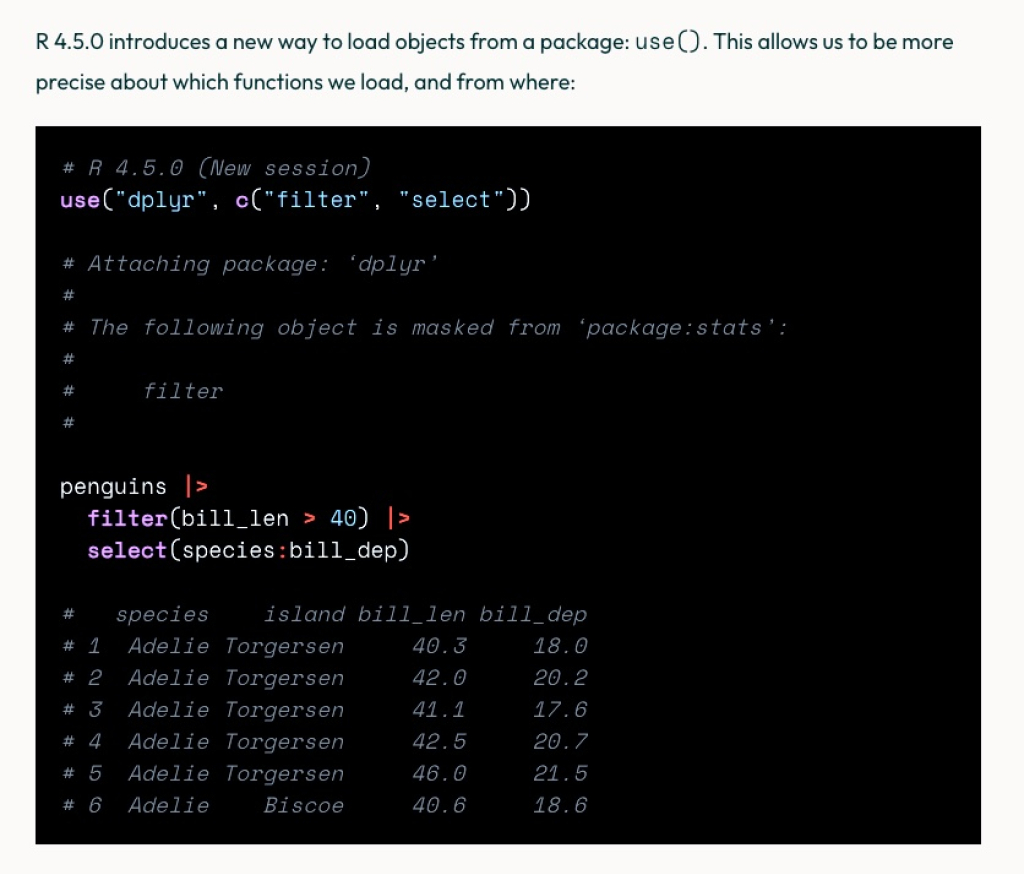
Russ Hyde of Jumping Rivers has compiled an overview of the latest updates and features in R 4.5.0. Perhaps most interesting is the new use() function, which allows you to load individual functions rather than having to always load an entire package.
Learning data viz from the best: the Financial Times
Daniel Roelfs provides a comprehensive guide on how to replicate the iconic data visualizations seen in the Financial Times. This tutorial walks you through the steps to create clean, informative, and visually appealing charts using R.
If you enjoyed this issue of What’s New In R, please share it with a friend! And if they want to get What’s New in R directly in their inbox, they can sign up on the R for the Rest of Us website.
Got any ideas for resources I should feature in future issues of What’s New in R? Leave a comment below!
Sign up for the newsletter
Get blog posts like this delivered straight to your inbox.

You need to be signed-in to comment on this post. Login.