Resources
This carefully curated collection of resources will help you find packages and learning resources to help you on your R journey.
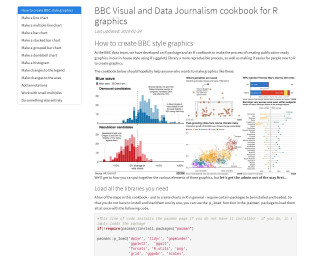
BBC Visual and Data Journalism cookbook for R graphics
The BBC Visual and Data Journalism team has crafted an R package, complemented by a cookbook, designed to assist in generating graphics in the BBC's signature style using the ggplot2 library in R. This resource streamlines the creation of professional-looking visuals and eases the learning curve for newcomers to R. The cookbook outlines the procedures for installation and usage of the necessary R packages, including 'bbplot', which is available directly from GitHub. It includes detailed guidance on customizing plots with BBC style elements, such as text size, font, and axis formatting, through practical examples with gapminder data.
Go to Resource
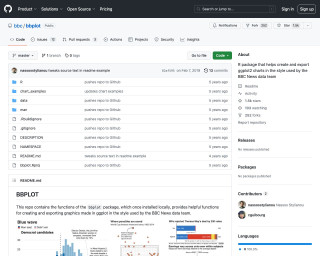
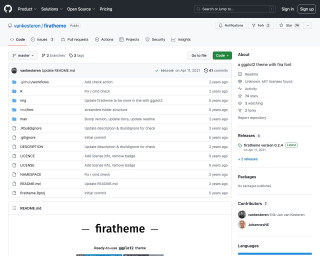
bbplot
R package that helps create and export ggplot2 charts in the style used by the BBC News data team
Go to Resource
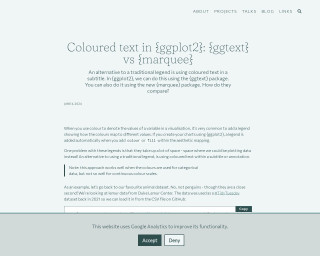
Coloured text in {ggplot2}: {ggtext} vs {marquee}
This content compares two R packages, {ggtext} and {marquee}, which allow users to add colored text to {ggplot2} visualizations as an alternative to a traditional legend. It discusses the suitability of this approach for categorical data and provides examples using lemur data from Duke Lemar Center. The tutorial includes data wrangling with {dplyr} and creating a scatter plot in {ggplot2}, as well as describing the use of HTML and CSS for text formatting in the {ggtext} package.
Go to Resource
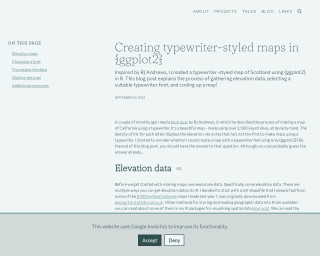
Creating typewriter-styled maps in {ggplot2}
This blog post by Nicola Rennie details how to create a typewriter-styled map of Scotland using the {ggplot2} package in R. The process involves gathering elevation data from a shapefile and using the {elevatr} package for accessing the elevation API. Selecting a suitable typewriter font with {sysfonts} and {showtext}, Rennie demonstrates how to represent different elevation levels with various letters in a monospace font. The final output replicates the appearance of a map created with a typewriter, reminiscent of RJ Andrews' handcrafted map of California using over 2,500 keystrokes.
Go to Resource

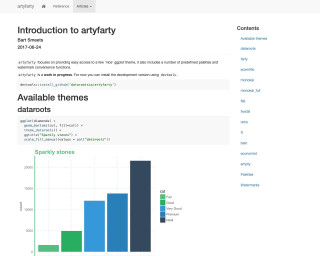
Getting started with theme()
This content is a tutorial on the theme() function in the ggplot2 package for R. It provides a practical guide to customizing the appearance of plots using theme(), starting from basic modifications to more advanced tweaks. The tutorial includes examples of modifying plot themes with pre-built ggplot2 themes and the use of the theme() function. It discusses altering legend positions, grid lines, and more nuanced theme elements for personalizing plots. The content is designed to help readers become comfortable and confident in adjusting plot aesthetics to match their preferred style or organizational standard.
Go to Resource
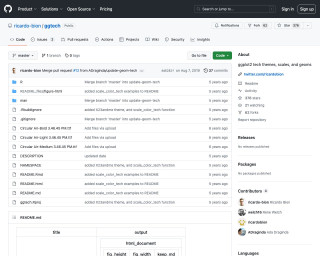
ggtech
ggtech is a package that provides ggplot2 tech themes, scales, and geoms for creating visually appealing plots in R.
Go to Resource
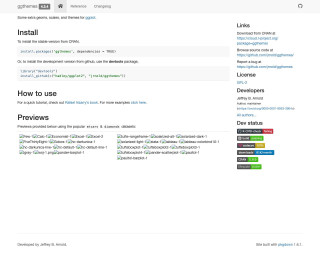
ggthemr
Themes for ggplot2. The idea of this package is that you can just set the theme and then forget about it. You shouldn't have to change any of your existing code.
Go to Resource
GitHub - hughjonesd/ggmagnify: Create a magnified inset of part of a ggplot object
Create a magnified inset of part of a ggplot object
Go to Resource