Resources
This carefully curated collection of resources will help you find packages and learning resources to help you on your R journey.
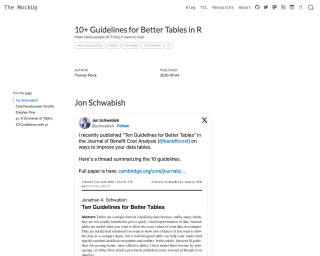
10+ Guidelines for Better Tables in R
The MockUp - 10+ Guidelines for Better Tables in R
Go to Resource
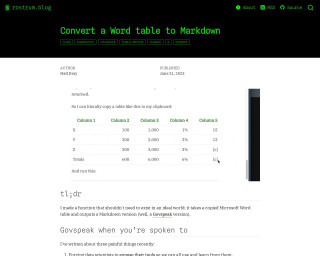
Convert a Word table to Markdown
The blog post describes a function created by the author to convert Microsoft Word tables into Govspeak Markdown, which is needed for publishing HTML files on GOV.UK. This process is typically tedious and demands attention to specific Govspeak features such as row labels and totals columns. The author introduces an R package named {wordup} that includes the function table_to_govspeak(), which handles input, guesses data types, and applies extra styles to the table conversion. It streamlines moving content from Word to Govspeak, which can be further facilitated by copying tables to the clipboard.
Go to Resource
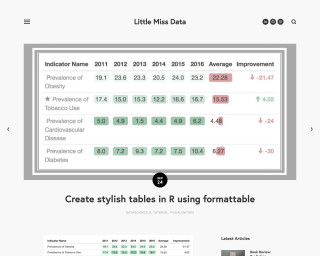
Create stylish tables in R using formattable
Create stylish tables in R using formattable
Go to Resource
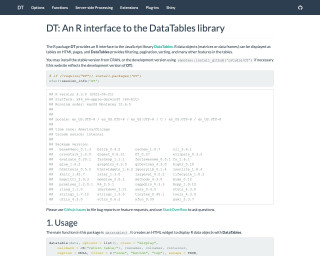
DT
An R package that provides an interface to the DataTables library, allowing R data objects to be displayed as interactive tables on HTML pages.
Go to Resource
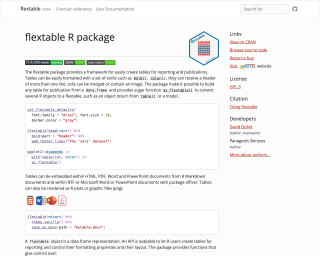
flextable
The flextable package provides a framework for easily creating tables for reporting and publications in R. It allows for easy formatting and customization of tables, and supports various output formats including HTML, PDF, Word, PowerPoint, and more. The package also provides functions for tabular reporting of statistical models and the creation of complex cross tabulations.
Go to Resource
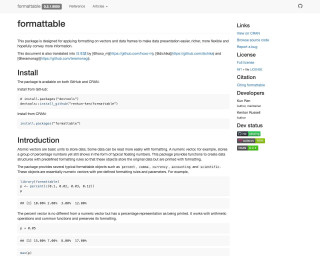
formattable
This package is designed for applying formatting on vectors and data frames to make data presentation easier, richer, more flexible and hopefully convey more information.
Go to Resource
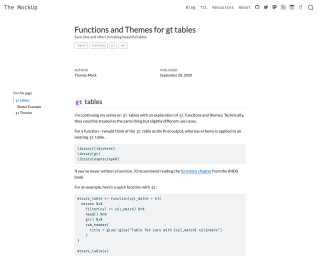
Functions and Themes for gt tables
A tutorial on using functions and themes for creating gt tables in R language.
Go to Resource
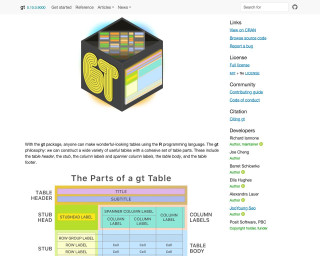
gt
With the gt package, anyone can make wonderful-looking tables using the R programming language.
Go to Resource
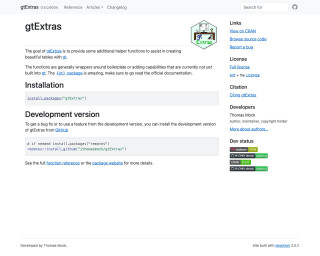
gtExtras
gtExtras is an R package that provides additional helper functions to assist in creating beautiful tables with the gt package.
Go to Resource

gtUtils
gtUtils is an R package designed to augment the capabilities of the 'gt' package, which is used for constructing eye-catching tables in R. It offers a range of themes, color functions, and additional utilities to make the tables more appealing and functional. The package includes features such as border bars and tools to create tier lists. Users can install it from GitHub and get started by consulting the provided vignettes, which include instructions for general use, applying table themes, and more. For further insights and examples, the author also encourages visiting their blog.
Go to Resource
How (and Why) I came to Use R for Data Analysis and Evaluation
Alberto Espinoza recounts his journey with R for data analysis and evaluation, marking his 10-year experience since first encountering R during his graduate assistantship. Initially clueless about R, he was tasked with assisting and leading statistics labs using R. Despite early challenges and a steep learning curve, he recognized R's power over software like SPSS or Excel. His continued use of R spanned graduate projects, market research, data preparation for Tableau, and Survey Monkey analysis. Espinoza outlines R's advantages: reproducibility, efficiency, clarity, and an extensive package ecosystem, underlining R's significance in his professional growth.
Go to Resource