Making 170+ Reports Automatically
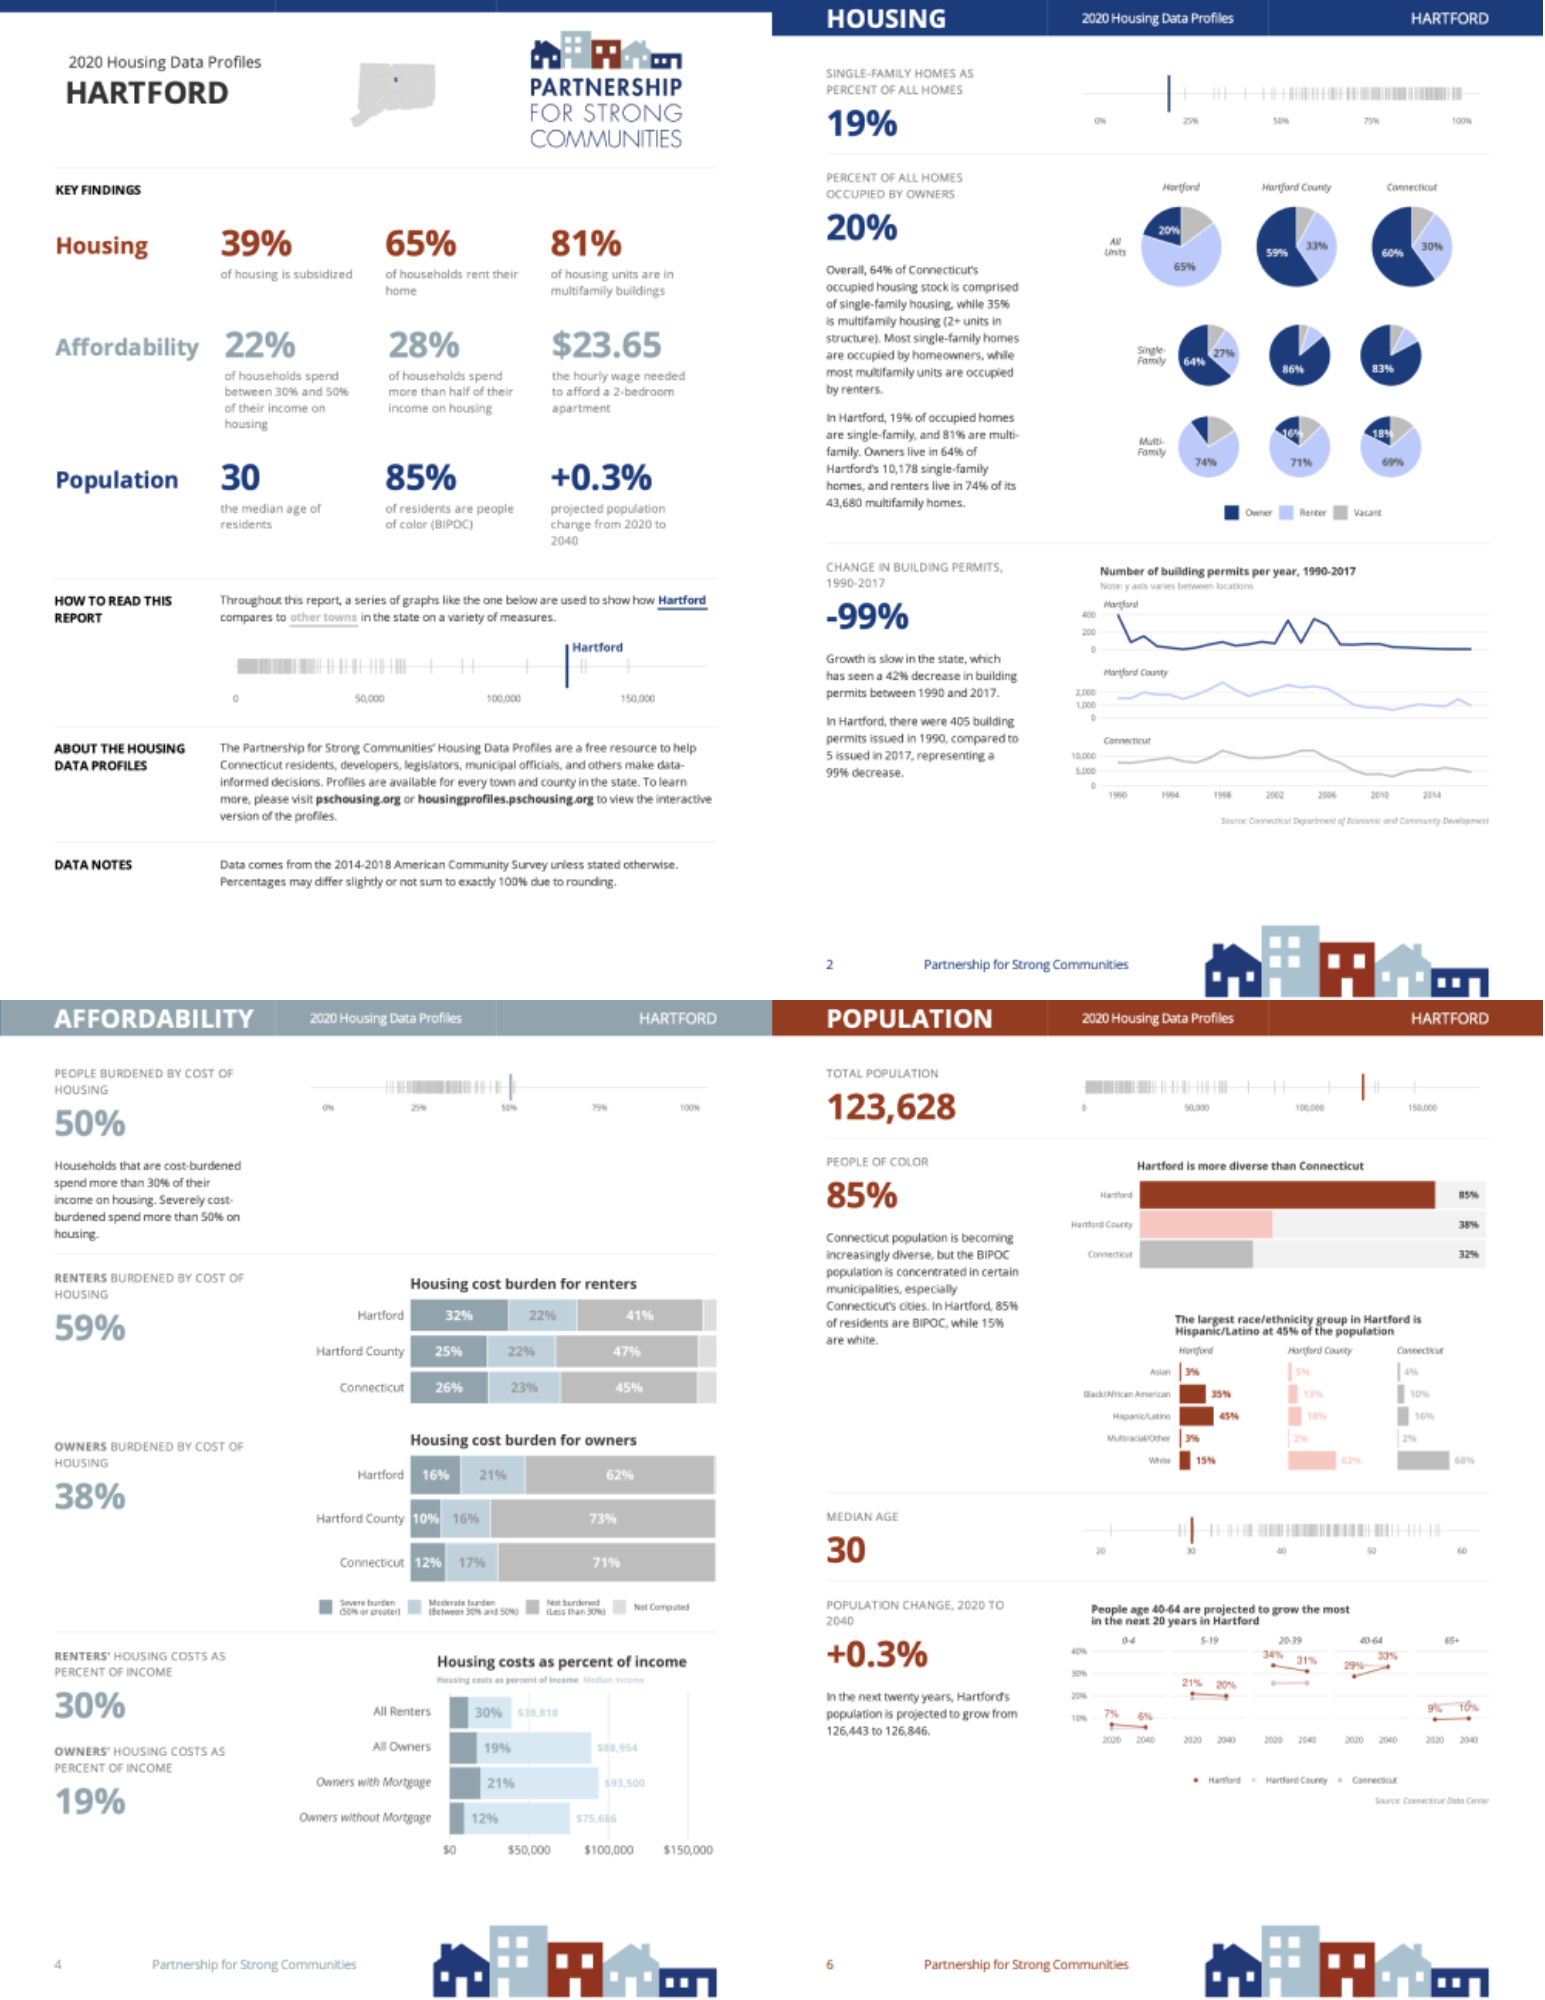
In 2020, the Partnership for Strong Communities (PSC) contracted with the Connecticut Data Collaborative (CTData) to update their Housing Data Profiles. These annual reports highlight key demographic and housing indicators for each of the 169 towns and 7 counties across the state. The reports are a sought-after reference that help policymakers, planners, and developers make informed decisions related to affordable housing in Connecticut.
PSC and CTData had a vision for the updated reports: data-based but not dry, with graphs and tables that would enable partners to understand the context in their community, and how it compares to other communities throughout the state. Historically, the reports had been generated manually for all of the different geographies. This had proven to be time consuming, cumbersome, and not sustainable. It was time to automate the process. It was this last requirement that led them to reach out to R for the Rest of Us.
Understanding that R could help automate what had become an untenable manual process, they reached out to discuss options. Working together, we developed a two-part plan:
Develop a highly customized report template that would allow the organizations to effectively communicate the data.
Use parameterized reporting to automatically generate the 170+ reports.
The work was a long and involved process, but yielded beautiful results. The final reports have a variety of data visualizations laid out in a way that makes it easy for stakeholders to get the insights they need.
Best of all, the automation of this process made generating the reports much more straightforward than doing it manually. In 2022, we updated the reports quickly and easily, using the code we had previously written.
Interested in learning more about our consulting services?
Drop us a line below.
