How I Structure My RStudio Projects
During his presidency, Barack Obama famously wore only gray or blue suits (with one minor exception). In a 2012 interview with Vanity Fair, he explained why:
I'm trying to pare down decisions. I don't want to make decisions about what I'm eating or wearing. Because I have too many other decisions to make.
This idea of using routines to limit the number of decisions you have to make and save your brain's processing power for important choices applies well beyond the sartorial choices of American presidents.
When I start a new project in R, I face a ton of choices. One of the most central choices is how to structure my files. For a long time, I used various configurations. Sometimes I'd put all of my functions in a single functions.R file; other times I'd sprinkle them throughout an RMarkdown document where I was writing my report.
Making choices about where files live is an example of a decision that you have to make, but isn't central to the main task at hand. Choosing file locations is to your R project as choosing suit colors is to Obama's presidency. It's important (you have to put your files somewhere and Obama has to wear some color suit) but it's not a choice to which you should devote a ton of mental energy.
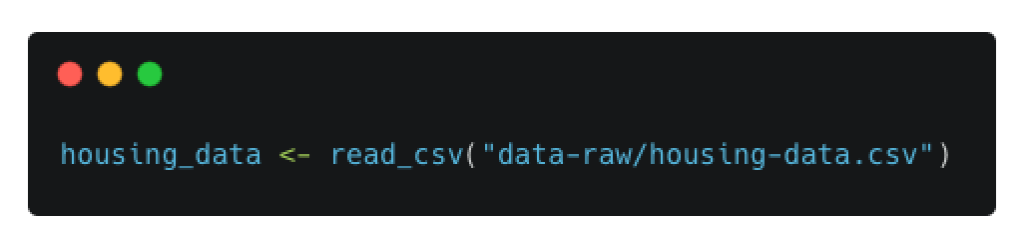
Before I share how I organize projects, an important note: if you are not yet using the projects feature of RStudio, you really should be. There are a number of reasons why they're valuable, many of which are summed up eloquently by Jenny Bryan, but the most important reason for our purposes is this: when you use projects, RStudio sets your working directory to be the root of your project.
Practically speaking, this means that when I create folders outlined below, I can use them by writing, say:
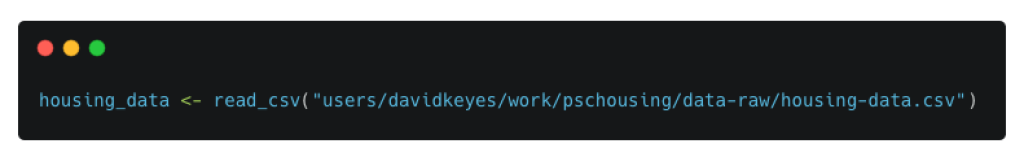
Rather than, say:
In 2020 and 2021, the consulting side of R for the Rest of Us has ramped up. We've taken on more projects helping organizations to communicate more effectively and efficiently:
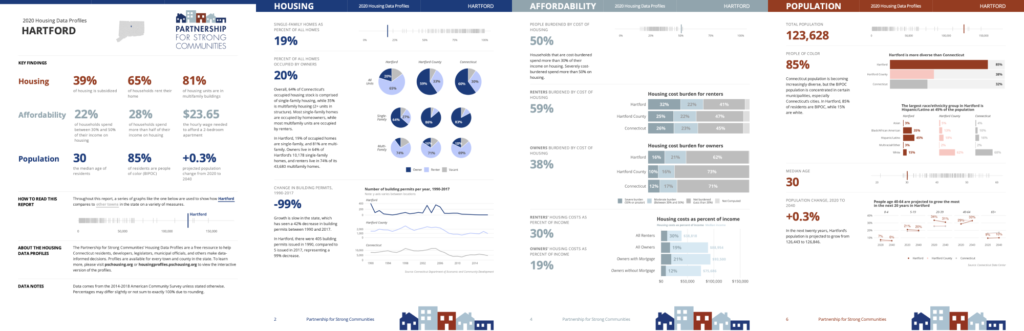
We worked with CTData to help the Partnership for Stronger Communities develop reports on housing in the state of Connecticut.
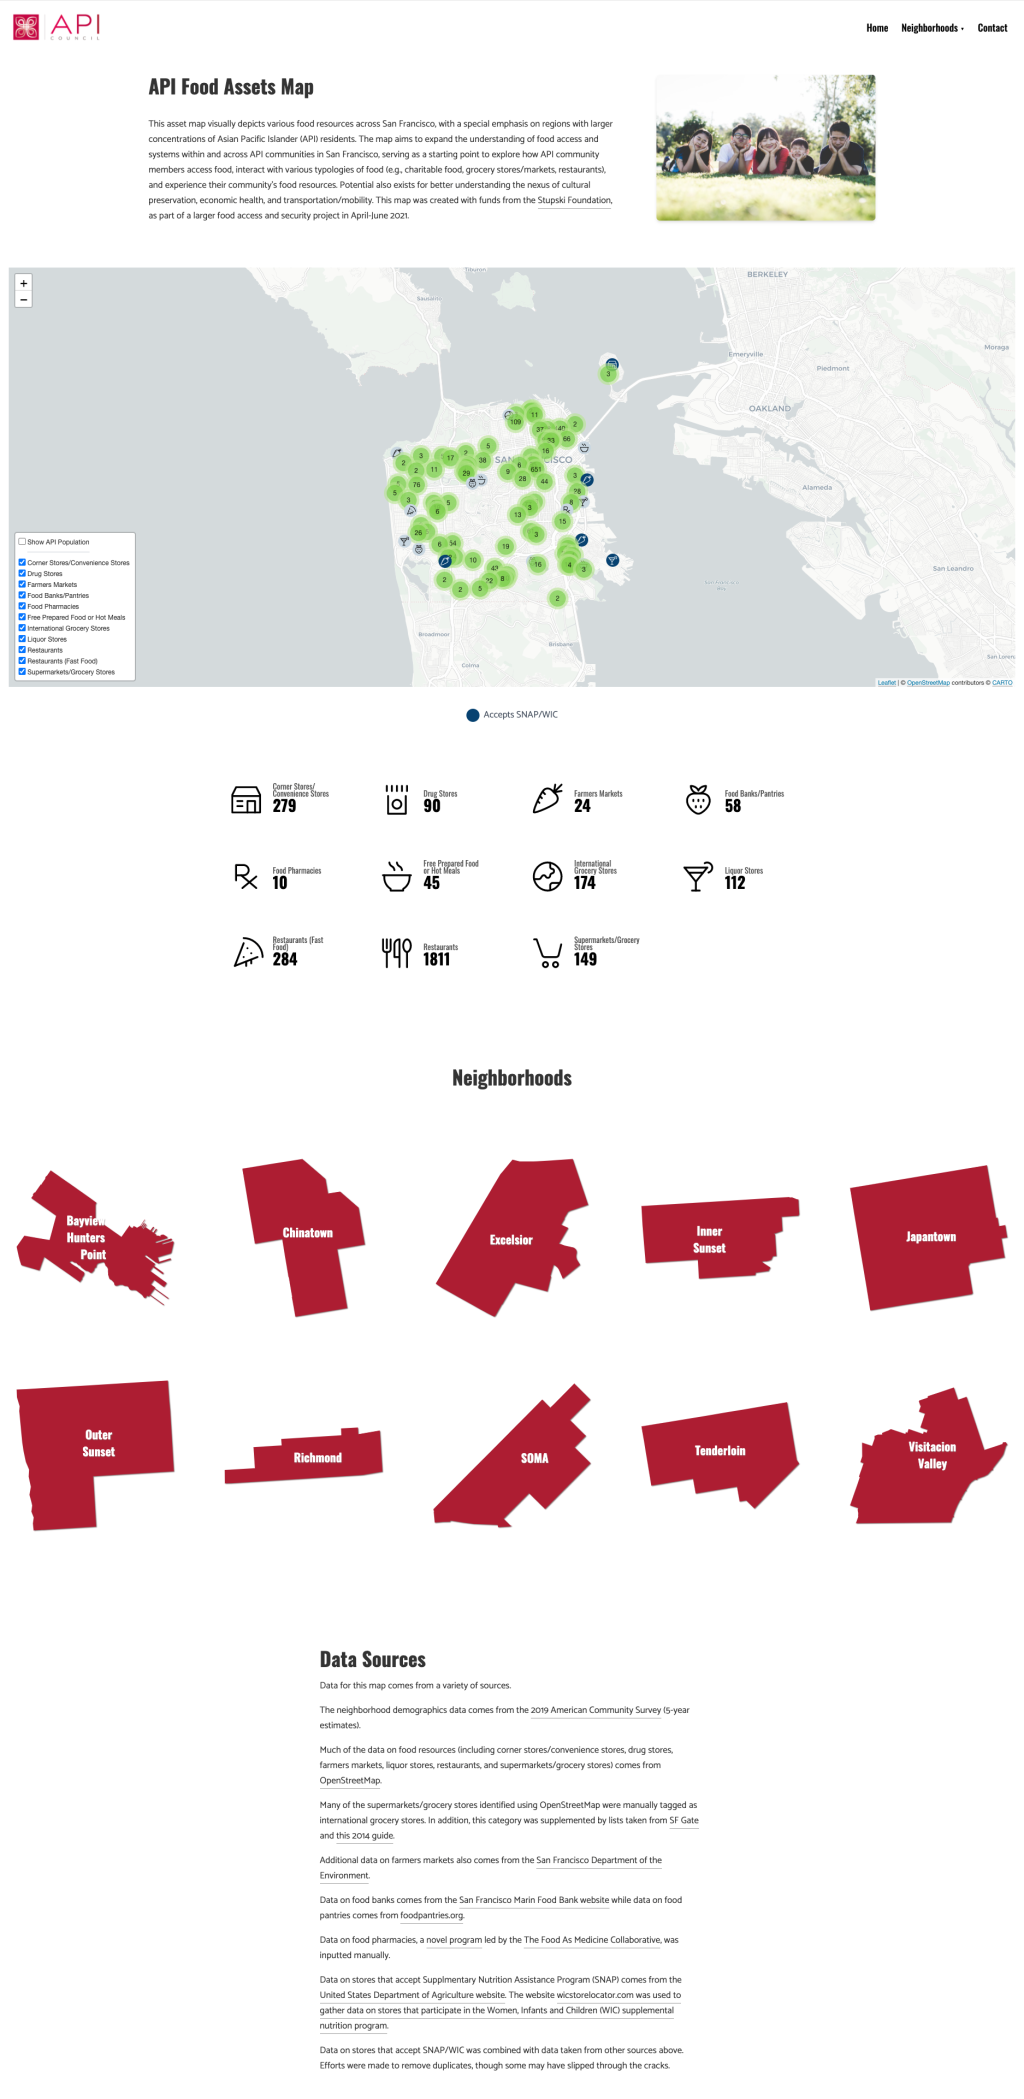
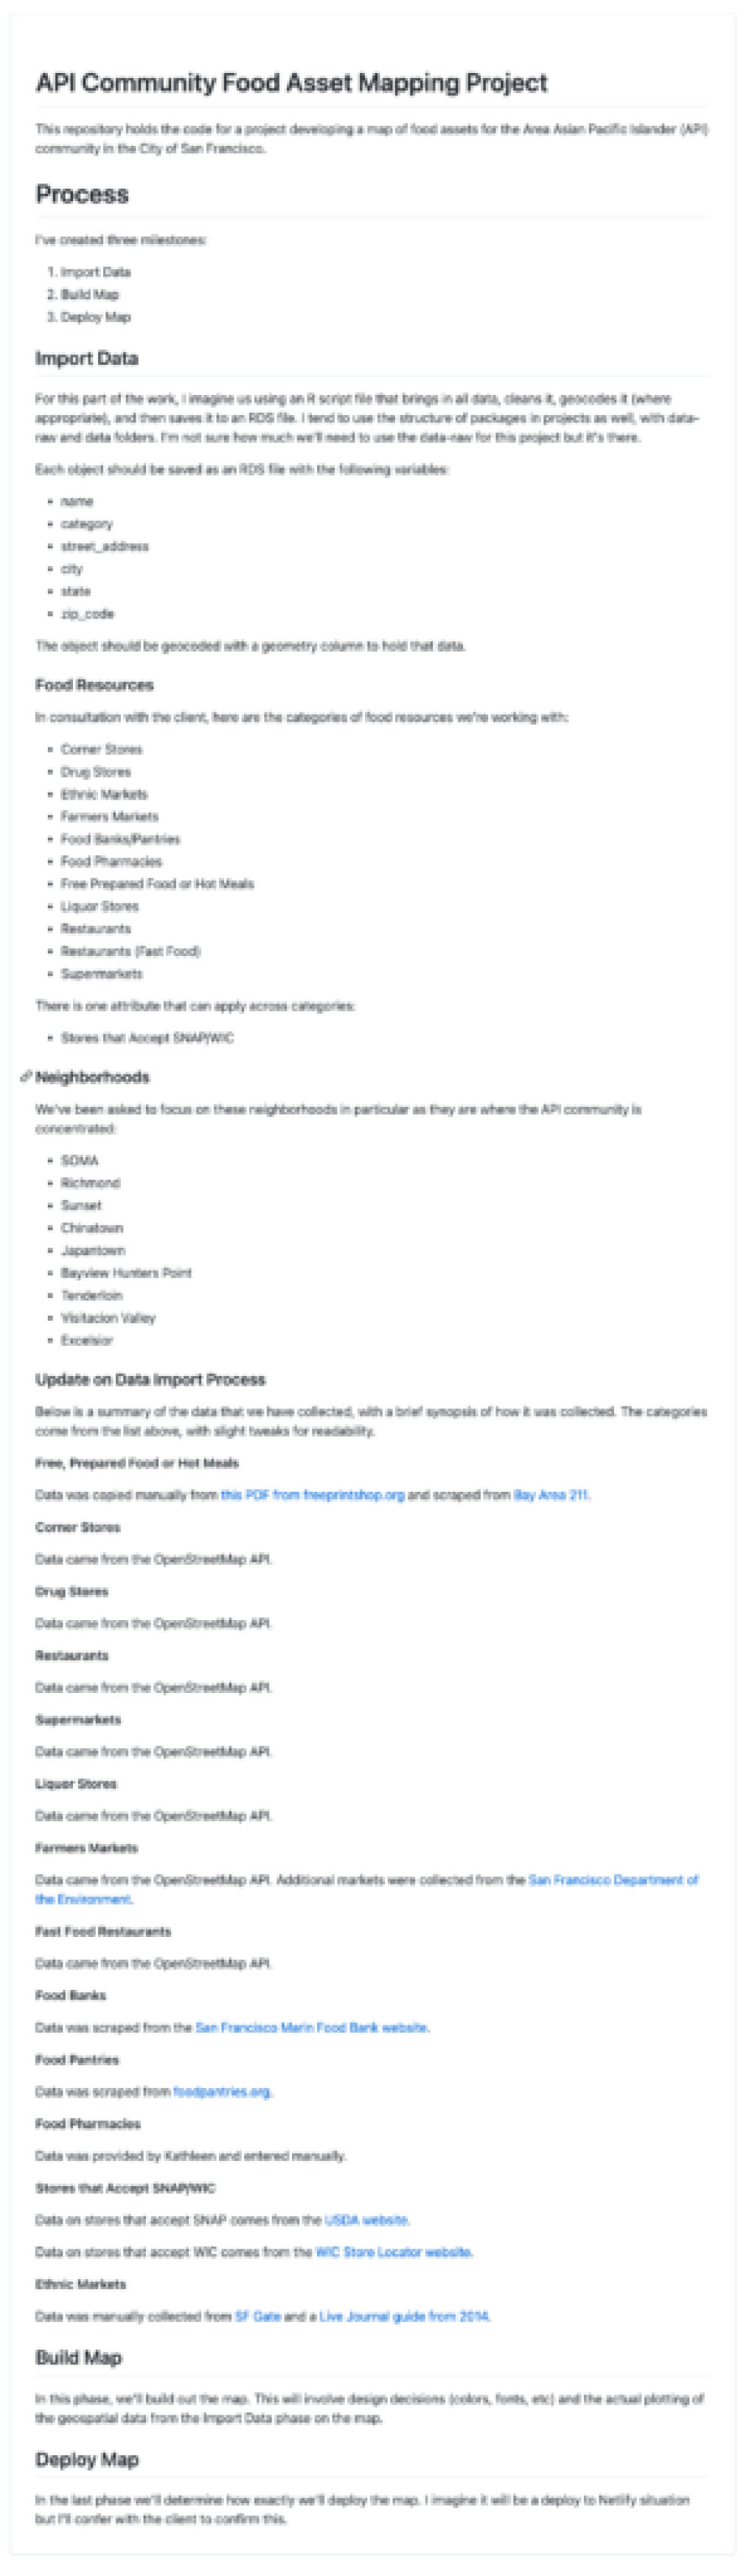
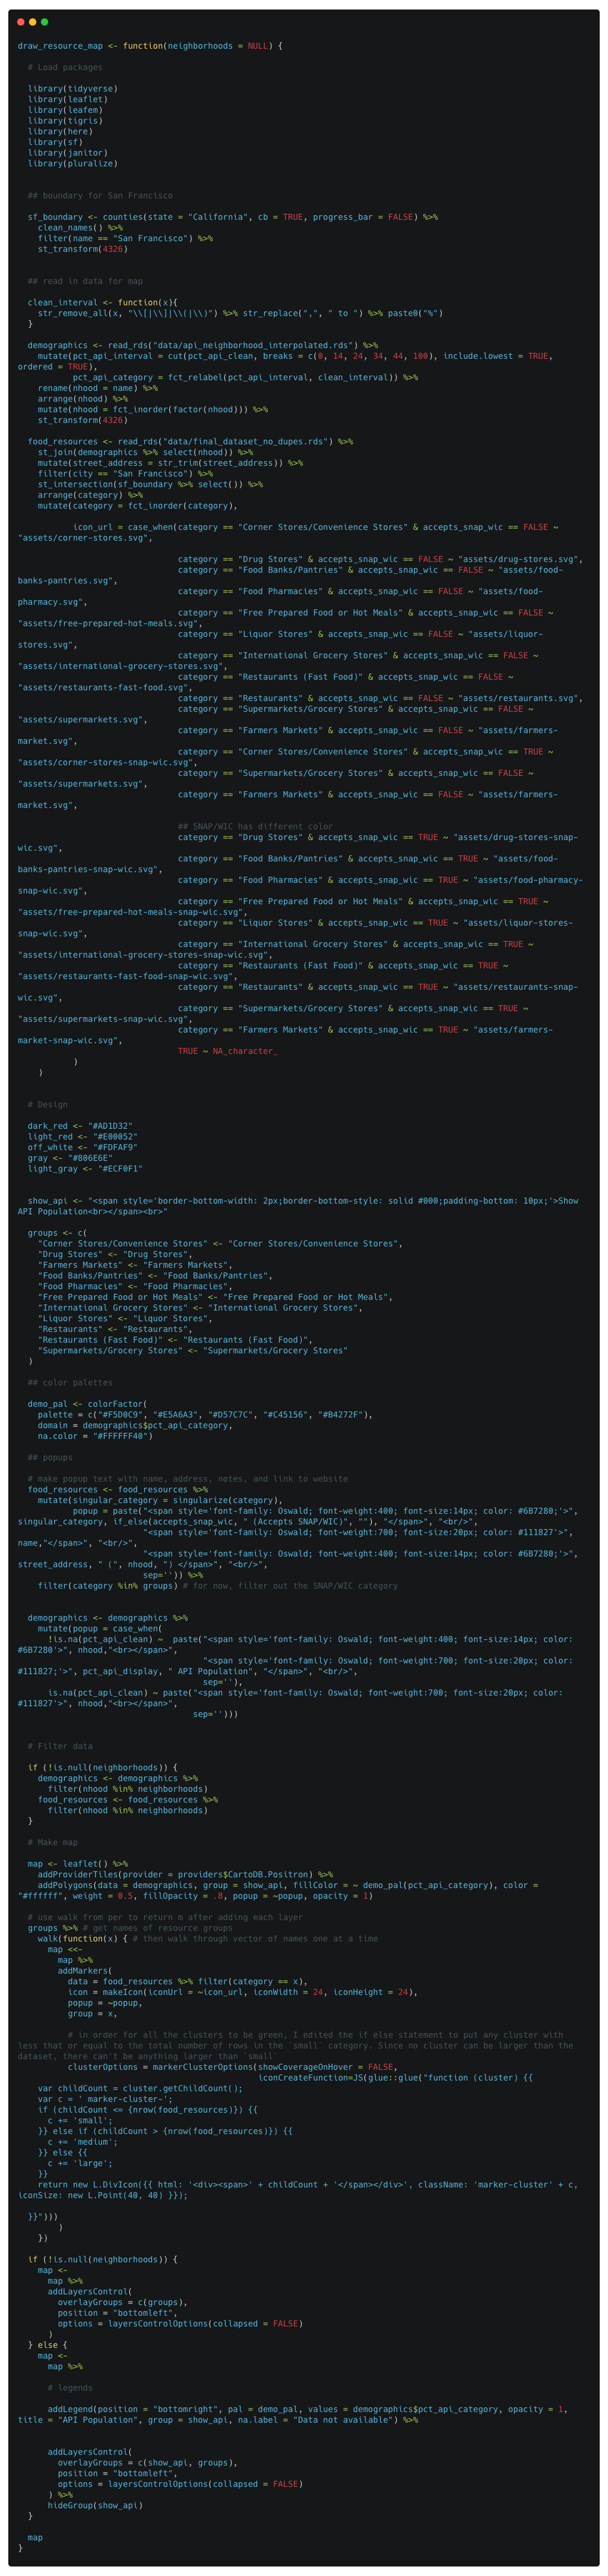
We worked with the Asian Pacific Islander Council of San Francisco to develop a map of food assets.
And we continue to support the Ford Family Foundation by developing all data visualizations for their annual Oregon by the Numbers project.
Working on these projects, I've begun to collaborate with talented partners like Thomas Vroylandt and Charlie Hadley. Working with others has forced me to think deeply about how to structure my files. If everyone brings their own idiosyncratic choices to a project, chaos will ensue. And even when I'm working alone on projects, I'll spend way too much time and brainpower deciding how to structure my files.
This is why I've come to a common file structure that I now use throughout all projects. Setting up all projects with these folders makes things simple and gives my brain space to focus on more important things. Here's how I now set up all projects:
README
Every project has a README.md file. This simple markdown file allows me to lay out a broad overview of the project. I explain the background, lay out the scope, and give an overview of the process. (A nice bonus is that, if you use GitHub, this README will show up on the associated repository.)
Raw data lives in data-raw
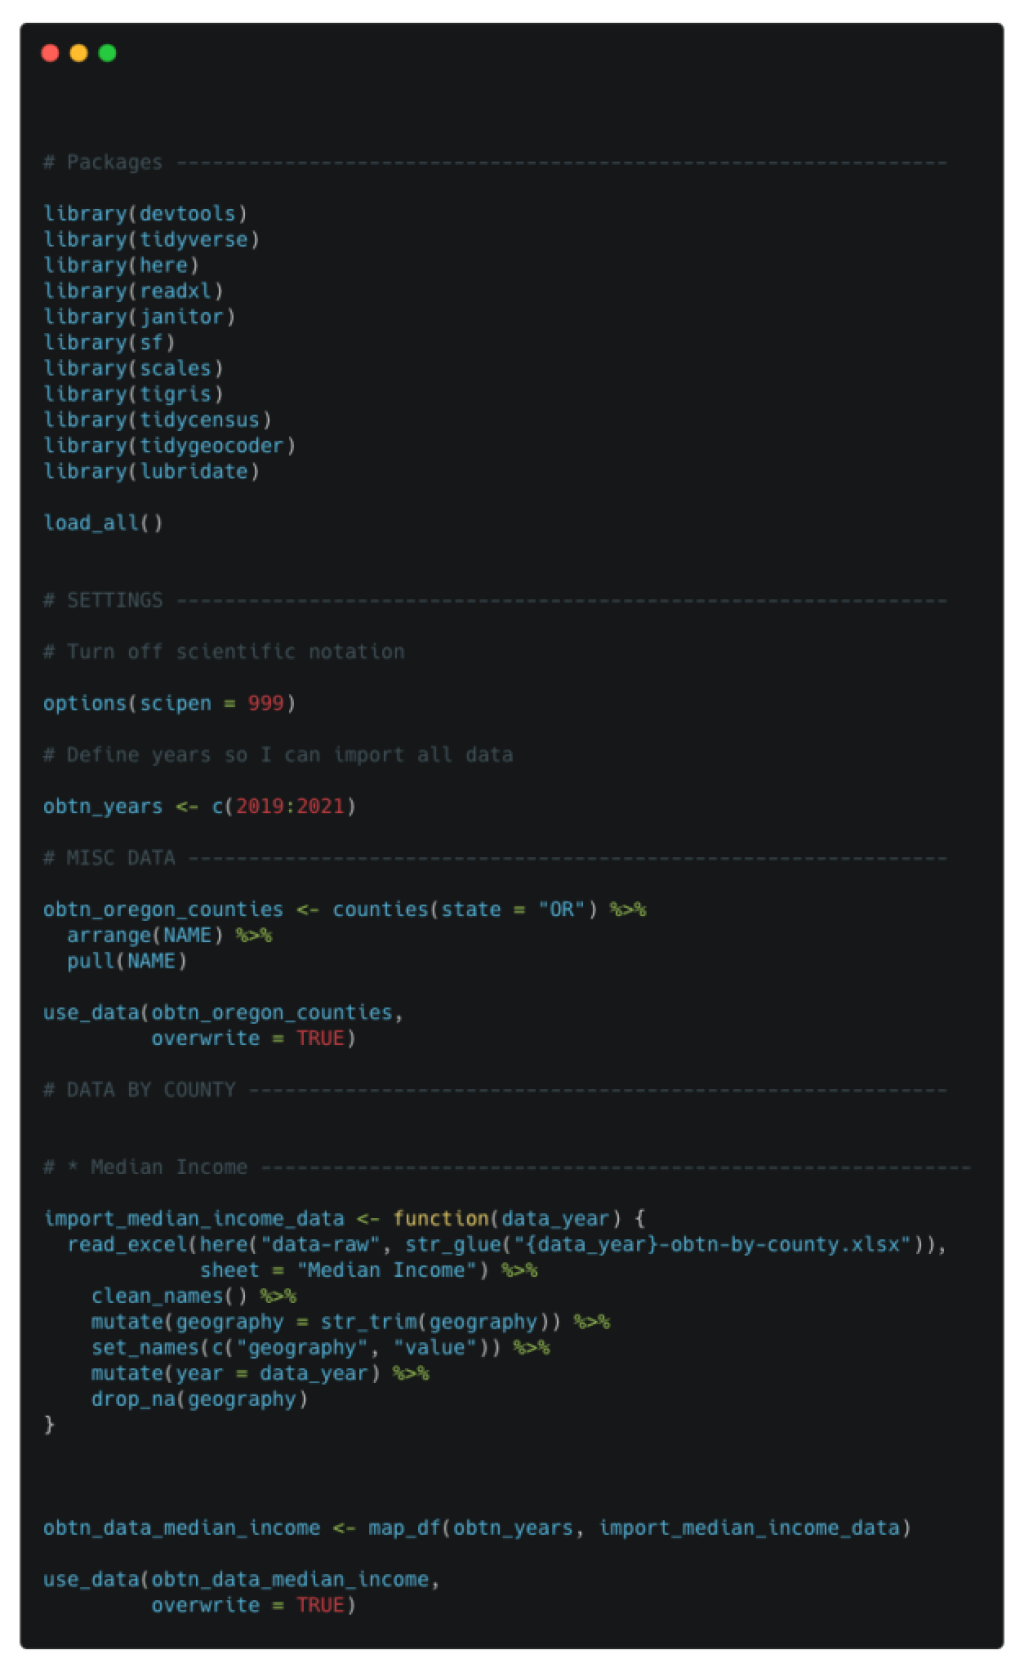
I use a data-raw folder to store all raw data. For many projects, this is a series of CSV or Excel files provided by clients. The most important thing about the data-raw folder is that I treat the data files within it as read-only. That is, I never change them by hand, but only in code that processes this data. This data processing typically happens in a file called import-data.R, which lives in this data-raw folder.
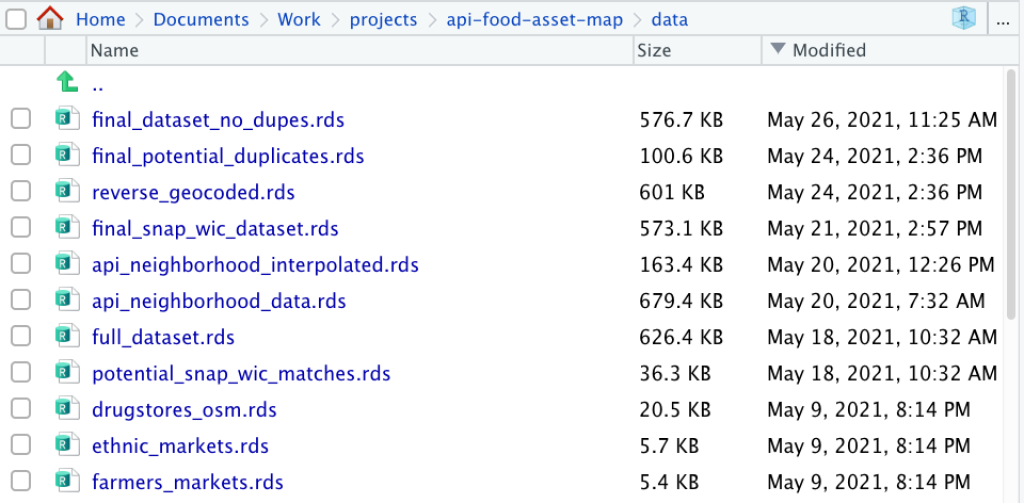
Cleaned and tidied data lives in data
My import-data.R file is designed, as much as possible, to get my data into the shape I need it in for reporting. Throughout this file, I save objects as RDS files in the data folder. This folder ends up holding a series of RDS files, each of which is a piece of cleaned and tidied data.
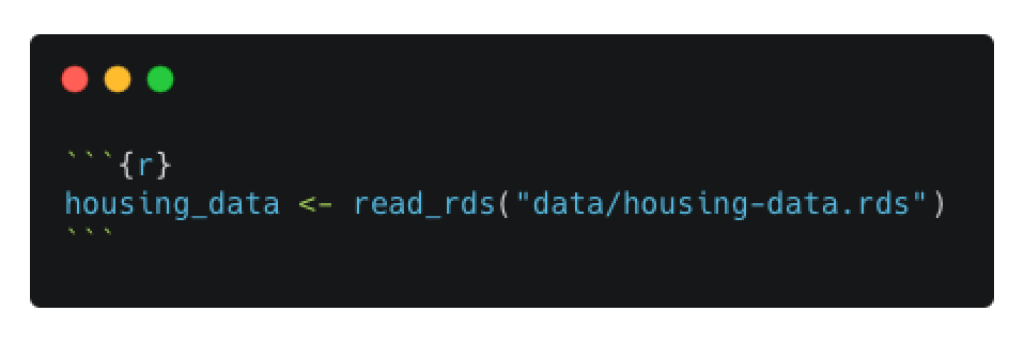
Reporting happens in RMarkdown documents
The actual reporting process takes place in an RMarkdown document (or documents if I’m doing creating a website with multiple pages like the API Council Food Assets Map above). I typically put my RMarkdown document in the root of my project. This file only ever works with the RDS files from the data folder (it never touches anything in the data-raw folder).
Functions go in script files in the R folder
Oftentimes, I have functions that I want to use throughout my project. I create an R folder and add R script files there that hold my functions. I put my functions in R script files in the R folder so I can use them in multiple RMarkdown documents (if I were to add functions in a single RMarkdown document, they would not be usable in other RMarkdown documents). For example, in the Asian Pacific Islander Food Assets Map, my team created a function to make interactive maps, which we reused on several pages on the final website that focused on individual neighborhoods.
Additional folders
The data-raw, data, and R directories, along with RMarkdown documents in the root of my project are how I structure all of my projects now. There are a few additional folders that I use as necessary:
reference-docsallows me to store any relevant material (e.g. old versions of reports)assetsis where I put things like company logos that will be used in final reportscssis where I store any custom CSS used to style reports
If you have ever made an R package, you’ll likely recognize the structure above. The idea of using data-raw and data folders comes directly from Hadley Wickham and Jenny Bryan’s suggested package structure. I started using this structure when developing my own packages and then realized it could be helpful even when I’m working on a regular data analysis project.
There are, of course, other ways to structure your projects. Krista DeStasio has written about how she structures projects, and Paul Stevenson has written about how the UK-based Telethon Kids Institute works in R. The most important thing is not so much the specifics of which folders you create, what you call them, etc. More important is the fact that you develop a structure that you can reuse for all projects you work on. Embrace the gray and blue suit. As noted R expert Barack Obama puts it, “You need to focus your decision-making energy. You need to routinize yourself. You can’t be going through the day distracted by trivia.”
Sign up for the newsletter
Get blog posts like this delivered straight to your inbox.

You need to be signed-in to comment on this post. Login.