What’s New in R: May 26, 2025
Welcome to this week’s edition of What’s New in R! This week, we’re featuring a workshop on creating websites with Quarto, a video tutorial on making dot density maps, and a package for more attractive visualizations of overlapping points. Let’s dive in!
Quarto website video series
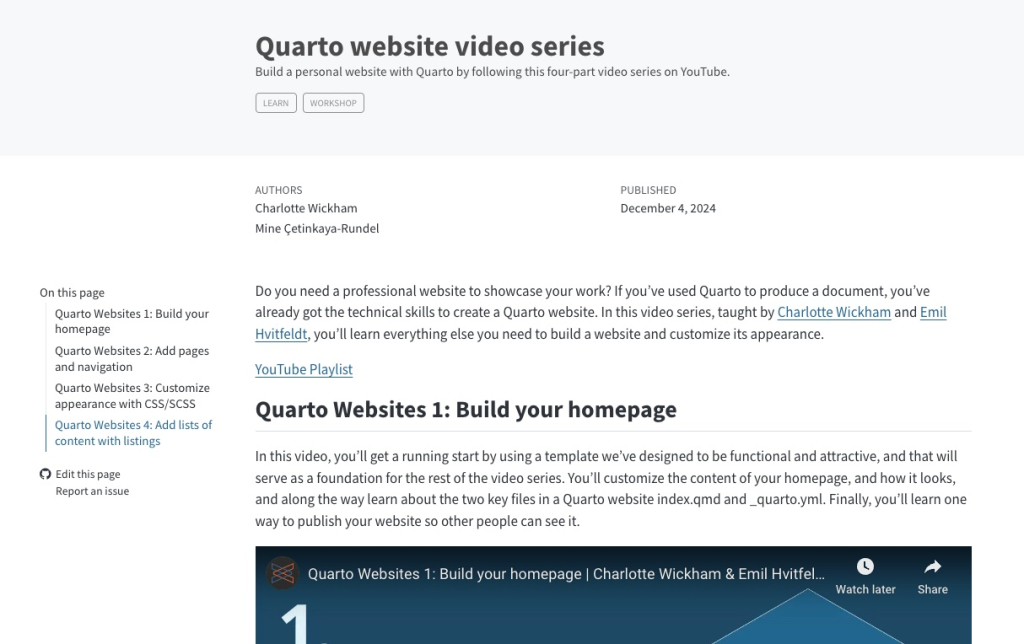
The Quarto team has a comprehensive workshop on building websites using Quarto. This detailed guide walks you through the process of setting up and customizing your own website, making it accessible even for those new to web development. It’s a fantastic resource for anyone looking to showcase their R projects or personal portfolio online.
Unlock 3D Dot Density Mapping in R Today!
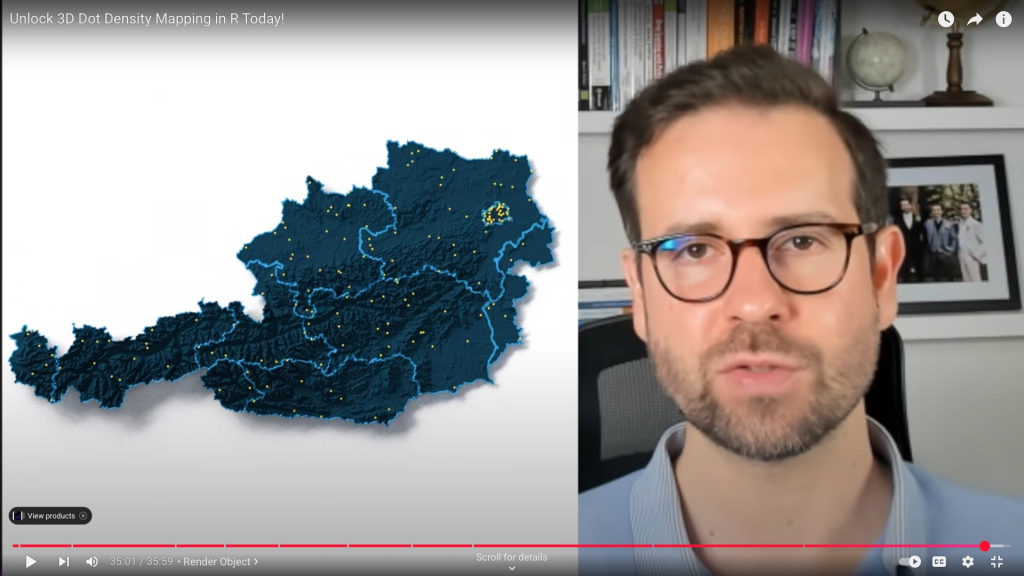
This video by Milos Popovic showcases how to make dot density maps in R. These maps, which cluster points to show the distribution of phenomena, can be a great tool to up your mapping game (it’s also something I teach in the newly-revised Mapping with R course).
Visualize and Analyze Your R Data (VAYR)
Alexander Coppock introduces {vayr}, a package designed to deal with overlapping points. While jittering using geom_jitter() is a common approach to deal with this problem, this package gives you other options:
If you enjoyed this issue of What’s New In R, please share it with a friend! And if they want to get What’s New in R directly in their inbox, they can sign up on the R for the Rest of Us website.
Got any ideas for resources I should feature in future issues of What’s New in R? Leave a comment below!
Sign up for the newsletter
Get blog posts like this delivered straight to your inbox.

You need to be signed-in to comment on this post. Login.