What’s New in R: June 1, 2026
Welcome to this week's edition of What's New in R! This week, we're featuring a blind taste test that uses R to find the best decaf coffee, an interactive data viewer that upgrades the default View() experience, and a Quarto extension that lets you draw on your slides while presenting. Let's dive in!
Using science to find the best decaf
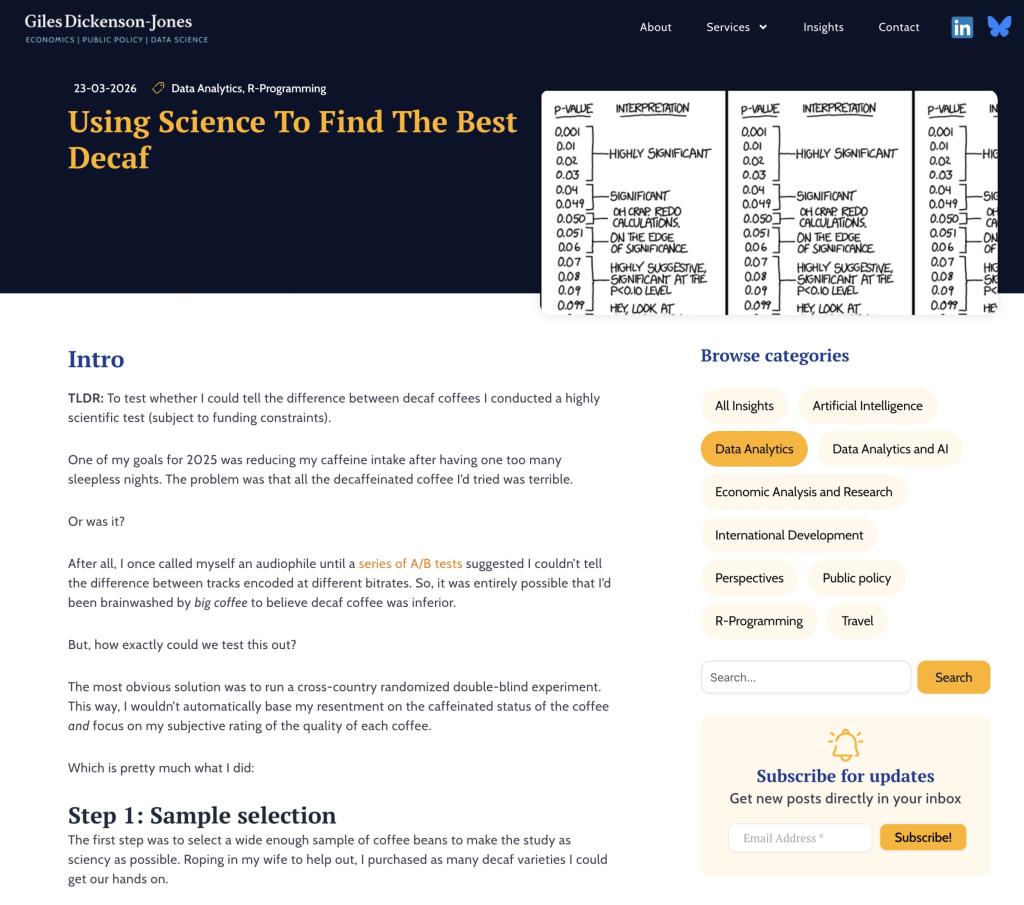
Giles Dickenson-Jones runs a double-blind taste test to figure out whether decaf coffee can really hold its own against the caffeinated stuff, and whether anyone can actually tell the difference when tasting blind. Even if coffee isn't your thing, the post is a fun, practical walkthrough of analyzing ranked preferences in R, using the tidyverse and {ggplot2} for visualization and Kendall's Tau and Spearman correlation to test whether two tasters' rankings agree. The verdict: people really can detect meaningful differences between coffees, and the store-bought caffeinated beans came out on top. It's a great example of using a small, everyday question as an excuse to flex some real statistical analysis.
Meet dataviewR: The View() You Always Wanted
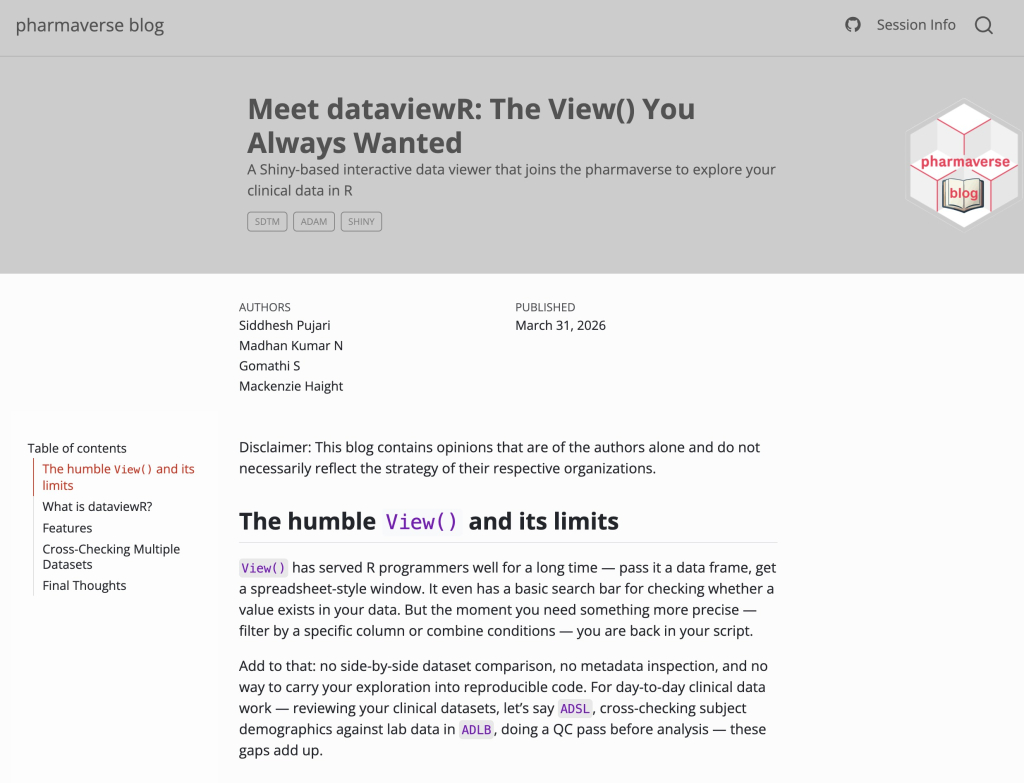
{dataviewR}, created by Siddhesh Pujari, Madhan Kumar N, Gomathi S, and Mackenzie Haight, is an interactive data viewer that addresses the limitations of R's basic View() function. It launches right inside the RStudio Viewer pane and adds interactive filtering with dplyr-style expressions, side-by-side dataset comparison, and variable metadata inspection, and it even generates reproducible code from the filters you apply, so your exploration feeds straight back into your scripts. If you've used the data explorer in Positron and wished RStudio had something similar, this is a real upgrade over the default viewer. No Shiny programming knowledge required to use it.
quarto-revealjs-tldraw
Emil Hvitfeldt's {quarto-revealjs-tldraw} extension lets you draw directly on your Quarto Reveal.js slides while you're presenting, powered by tldraw v4. Press the T key to toggle drawing mode, annotate your slide with the full tldraw toolbar, and your drawings are saved per-slide automatically via localStorage. It's a genuinely useful touch for live presentations, whether you're circling a key result or sketching out an idea on the fly. Installation is a one-liner with quarto add, plus a single entry in your presentation's YAML.
If you enjoyed this issue of What’s New In R, please share it with a friend! And if they want to get What’s New in R directly in their inbox, they can sign up on the R for the Rest of Us website.
Got any ideas for resources I should feature in future issues of What’s New in R? Leave a comment below!
Sign up for the newsletter
Get blog posts like this delivered straight to your inbox.

You need to be signed-in to comment on this post. Login.