Resources
This carefully curated collection of resources will help you find packages and learning resources to help you on your R journey.
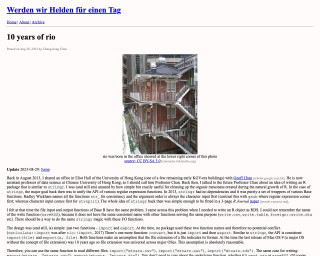
10 years of rio
This is a blog post titled '10 years of rio' by Chung-hong Chan. It discusses the history and development of the R language package 'rio', which is similar to stringr. The author talks about the motivation behind creating the package and the design principles used. The package provides functions for importing and exporting data in various formats, with a consistent API. The post also mentions the compatibility of the package with older versions of R.
Go to Resource
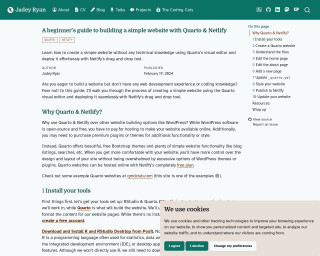
A beginner’s guide to building a simple website with Quarto & Netlify
This content is a tutorial for beginners on creating a simple website using Quarto and deploying it with Netlify. It guides users through the installation of RStudio and Quarto, the process of creating a Quarto website, and understanding the necessary files. The guide highlights the benefits of using Quarto and Netlify over other website platforms and provides a stress-free approach for those without web development experience. It includes step-by-step instructions to ensure even complete novices can achieve a professional online presence quickly and easily.
Go to Resource
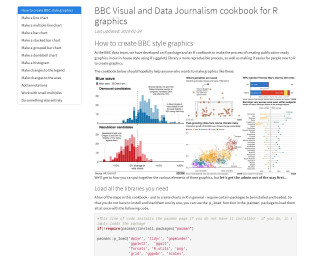
BBC Visual and Data Journalism cookbook for R graphics
The BBC Visual and Data Journalism team has crafted an R package, complemented by a cookbook, designed to assist in generating graphics in the BBC's signature style using the ggplot2 library in R. This resource streamlines the creation of professional-looking visuals and eases the learning curve for newcomers to R. The cookbook outlines the procedures for installation and usage of the necessary R packages, including 'bbplot', which is available directly from GitHub. It includes detailed guidance on customizing plots with BBC style elements, such as text size, font, and axis formatting, through practical examples with gapminder data.
Go to Resource
![Screenshot of Big Book of R at 400 [New milestone!]](/img/containers/screenshots/oscarbaruffa-com-bbor_400.jpg/74e022268aa288d6c1711920b3365082.jpg)
Big Book of R at 400 [New milestone!]
Oscar Baruffa's 'Big Book of R' has reached a new milestone with over 400 entries of mostly free R books, witnessing the growth of an invaluable resource for the R community. Acknowledging contributors and the support of visitors, Baruffa emphasizes the quality and impact of the collection. The announcement highlights the costs associated with hosting the 'Big Book of R' and encourages contributions. New additions cover topics like big data analytics, hierarchical compartmental reserving models, R package design, epidemiology, causal data science, and psychometrics, showcasing the diversity and depth of the resources available.
Go to Resource
Branding and automating your work with R Markdown
This video is about branding and automating work with R Markdown. It discusses how a team of data scientists uses advanced features in RStudio to brand reports and presentations for clients. The speaker highlights lessons learned in areas like version control and automation, including how a few lines of code allowed them to create a specialized report on crime for every county in Utah.
Go to Resource

Building a Linkedin data visualisation template with Quarto and Typst
Aaron Schiff shares a method for sharing data visualizations on Linkedin using Quarto and Typst. He created a template that allows for the production of nicely formatted PDFs to circumvent Linkedin's subpar image handling. The template includes a topic heading, summary text, a ggplot chart, data source citation, optional two-column text, and a footer. Additionally, Schiff explains the synergy of Quarto, a publishing system, and Typst, a layout framework, to streamline the production of visually appealing PDFs. He provides guidance on creating a Quarto Typst template and how to use it with example code and the configuration process.
Go to Resource

Building Stories With Data - Fixing awkward backgrounds in ggplot2
In this article, Cara Thompson shares a solution for fixing awkward backgrounds in ggplot2 when using fixed coordinate systems like coord_sf() or coord_polar(). The issue arises when the background color does not cover the entire export area. She offers several solutions, including one that she finds more elegant, involving the use of the {cowplot} package. By implementing a simple function, one can ensure the background color fills the full plotting area, enhancing the visual consistency of custom-themed graphs and maps within documents.
Go to Resource
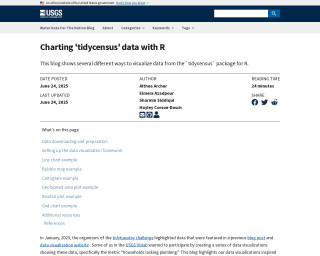
Charting 'tidycensus' data with R
This blog post by USGS Vizlab discusses how to use the 'tidycensus' R package to download and visualize U.S. Census Bureau data. It highlights visualizations such as line charts, bubble maps, cartograms, geofaceted area plots, rainfall plots, and grid charts. The post includes code examples and downloadable functions from GitHub to replicate these visualizations using data on 'households lacking plumbing' from the 2022 and 2023 ACS. It offers a practical guide for users interested in creating similar visualizations for demographic and socioeconomic data within the United States.
Go to Resource

Chat with Large Language Models • {ellmer}
The 'ellmer' package facilitates the use of large language models (LLMs) directly from R. It provides access to multiple LLM providers and features like streaming outputs and structured data extraction. 'ellmer' supports models such as Anthropic's Claude, AWS Bedrock, and OpenAI's GPT, among others. The package offers interactive and programmatic ways to converse with models, maintaining the conversation state, which is useful for building on previous interactions. 'ellmer' is practical for both organizational and personal use, accommodating various IT restrictions and preferences.
Go to Resource
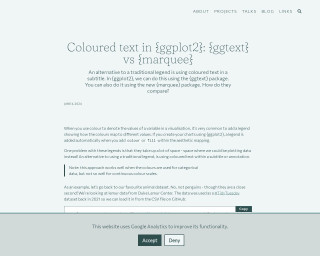
Coloured text in {ggplot2}: {ggtext} vs {marquee}
This content compares two R packages, {ggtext} and {marquee}, which allow users to add colored text to {ggplot2} visualizations as an alternative to a traditional legend. It discusses the suitability of this approach for categorical data and provides examples using lemur data from Duke Lemar Center. The tutorial includes data wrangling with {dplyr} and creating a scatter plot in {ggplot2}, as well as describing the use of HTML and CSS for text formatting in the {ggtext} package.
Go to Resource
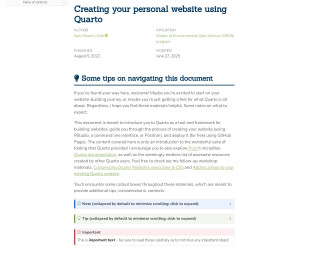
Creating your personal website using Quarto
This document by Sam Shanny-Csik offers an introductory guide to creating personal websites using Quarto. It covers the basics of Quarto as a multipurpose publishing system built on Pandoc and how it integrates with languages like R, Python, and Julia for dynamic content creation. The tutorial explains the similarities and differences between RMarkdown and Quarto Markdown files, provides tips for code chunk execution, and guides readers through deploying their Quarto website using GitHub Pages. Additionally, it encourages exploring further resources on Quarto and the possibility of using other R-based tools or HTML templates for website creation.
Go to Resource
flair
flair is an R package that provides tools for formatting R code in knitted R Markdown files.
Go to Resource