Resources
This carefully curated collection of resources will help you find packages and learning resources to help you on your R journey.
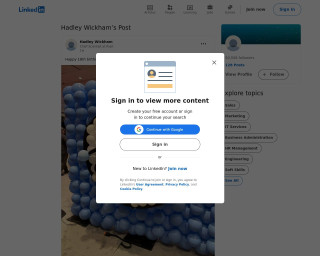
Happy 18th birthday ggplot2!
This content celebrates the 18th birthday of the data visualization package ggplot2, created by Hadley Wickham. It illustrates the significance and widespread appreciation of ggplot2 within the data science community through comments and reactions from various users. Comments highlight how ggplot2 has revolutionized the creation of data plots in R, and the playful puns acknowledge the package's 'maturity' with references to drinking age and bar charts. The community expresses gratitude towards Wickham and his team for their contributions to the R ecosystem.
Go to Resource

Hillshade effects
Dr. Dominic Royé's blog post on hillshade effects explains creating relief maps in R with shadow effects to generate visual depth. He uses several R packages, including 'sf' for vector data, 'elevatr' for elevation API access, 'terra' for raster manipulation, 'whitebox' for geospatial analysis, and 'ggplot2' extensions for scales and color blending. The tutorial covers installing packages, importing and filtering lake boundaries, and manipulating Digital Elevation Models (DEMs) for Switzerland, with reproducible R code snippets.
Go to Resource
How (and Why) I came to Use R for Data Analysis and Evaluation
Alberto Espinoza recounts his journey with R for data analysis and evaluation, marking his 10-year experience since first encountering R during his graduate assistantship. Initially clueless about R, he was tasked with assisting and leading statistics labs using R. Despite early challenges and a steep learning curve, he recognized R's power over software like SPSS or Excel. His continued use of R spanned graduate projects, market research, data preparation for Tableau, and Survey Monkey analysis. Espinoza outlines R's advantages: reproducibility, efficiency, clarity, and an extensive package ecosystem, underlining R's significance in his professional growth.
Go to Resource
How to create CUSTOM Callout Boxes in Quarto - YouTube
This video tutorial demonstrates how to create custom callout boxes in Quarto, a document authoring system in R. Quarto allows you to customize your callout boxes to make your documents visually appealing and informative.
Go to Resource

How to Make Slides in R Using xaringan
A tutorial on how to make slides in R using xaringan
Go to Resource
Iterate parameterised {xaringan} reports
Learn how to iterate parameterised xaringan reports using R. This tutorial demonstrates how to create a parameterised R Markdown template and iterate over parameter values to generate multiple reports with different data.
Go to Resource
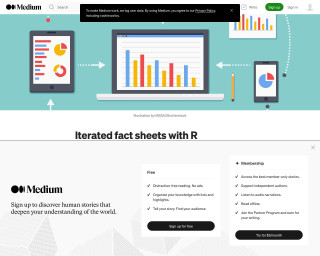
Iterated fact sheets with R Markdown
This article explains how to use R Markdown to create iterated fact sheets. It provides an overview of R Markdown, discusses the necessary ingredients for creating multiple fact sheets, and provides examples using the bad_drivers dataset.
Go to Resource
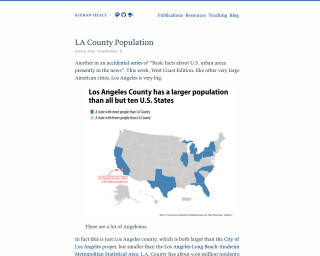
LA County Population Data Viz
This content outlines a detailed example of accessing and visualizing population data for Los Angeles County using R programming language. It provides insights into the population size of LA County compared to the city proper and the greater metropolitan area. Additionally, the text includes R code that interacts with the U.S. Census Bureau API, demonstrating how to retrieve, filter, and arrange population estimates with county-level granularity and geometry data for mapping. The snippet focuses on data manipulation and visualization techniques using tidyverse and tidycensus, highlighting the practical application of these tools in demographic analysis.
Go to Resource

Mapping water insecurity in R with tidycensus
This content provides a comprehensive guide on utilizing the tidycensus package in R to map water insecurity based on American Community Survey data. It elaborates on setting up the tidycensus environment, exploring Census Bureau variables, and performing data processing. Techniques like data visualization with tigris and sf packages are also covered. The tutorial highlights differences in plumbing facilities and compares population versus plumbing access across Western U.S. counties. With practical code examples, it aids readers in understanding and visualizing the spatial variation of social vulnerability indicators affecting water insecurity.
Go to Resource
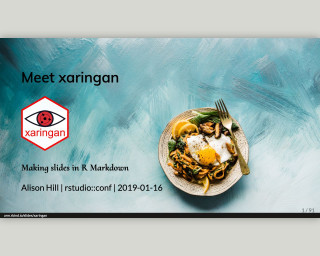
Meet xaringan: making slides in RMarkdown
This is a tutorial on how to make slides with R Markdown using the xaringan package.
Go to Resource