Analyzing the R for the Rest of Us Audience Survey
In February, I asked you to help me figure out what to do next with R for the Rest of Us. As I wrote at the time:
Moving forward, I want to focus my efforts on the types of learning that resonate with you. I’m also thinking about offering opportunities to learn about particular topics that I think people might be interested in (e.g. mapping with R). But again, I don’t know which topics will resonate with my audience unless I ask you.
Nearly 200 of you were generous enough to respond to the survey. This gave me some great data to think about next steps. Here's what I took from what you told me.
What you told me
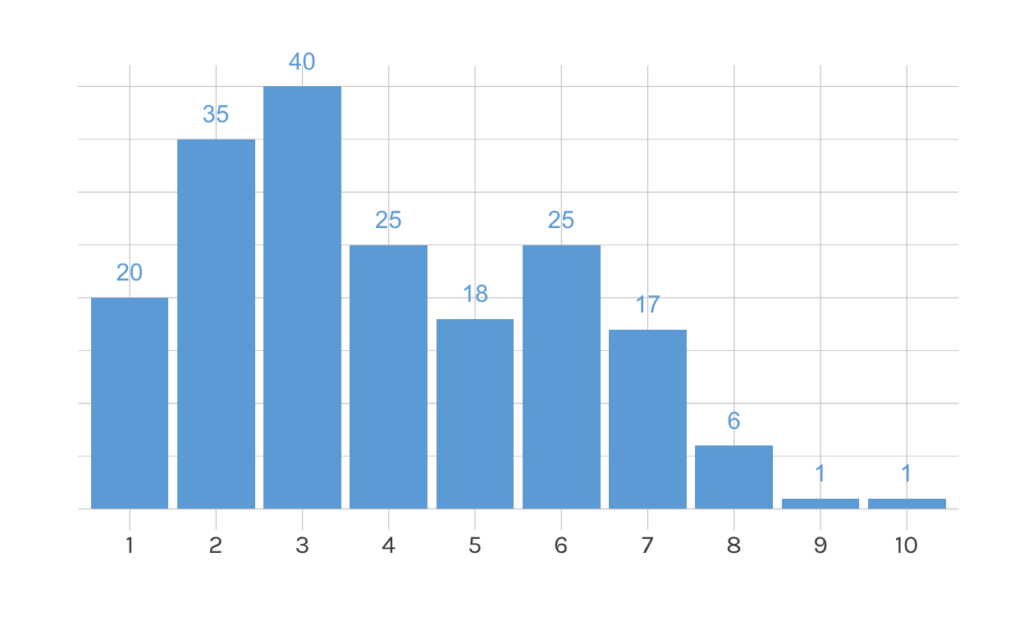
I asked you to rate your R proficiency on a 10-point scale. I’ve intentionally focused on people just starting out with R so I expected most people to rate at the low end of the scale. Interestingly, the mean proficiency was 3.9 — higher than I would have guessed! Here’s the distribution of proficiency levels:
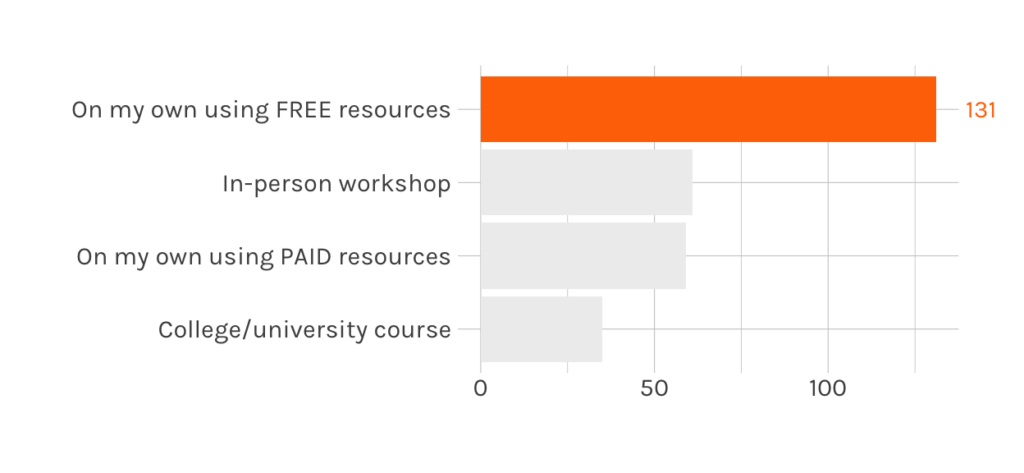
I found that most people had learned R using free resources. There are so many great resourcesout there so that makes sense!
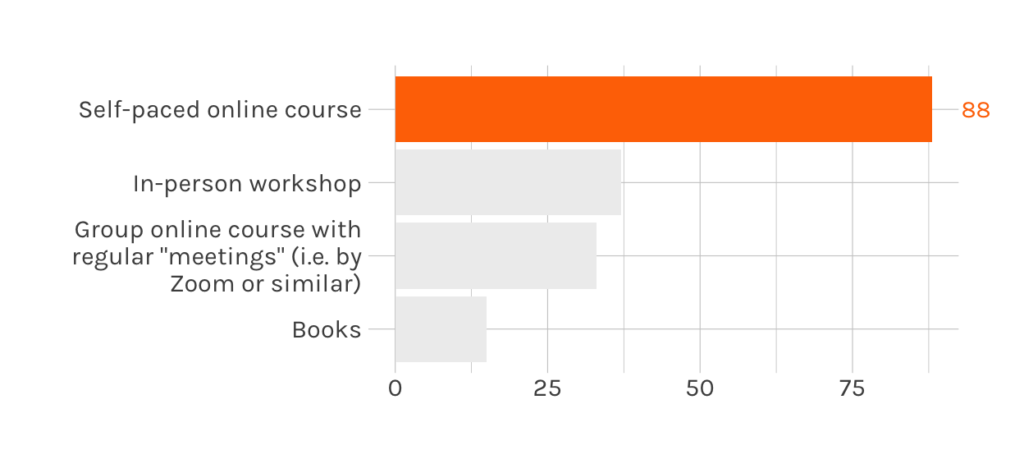
I also asked how people like to learn about R and other data-related tools. The most common response was self-paced online courses. Surprisingly (to me at least), only 33 folks said they liked learning in online settings with regular "meetings." I have had many people say they want options like this to keep them accountable and on track so I expected more! My guess is that, because this type of group course is less common, people think about it less an option.
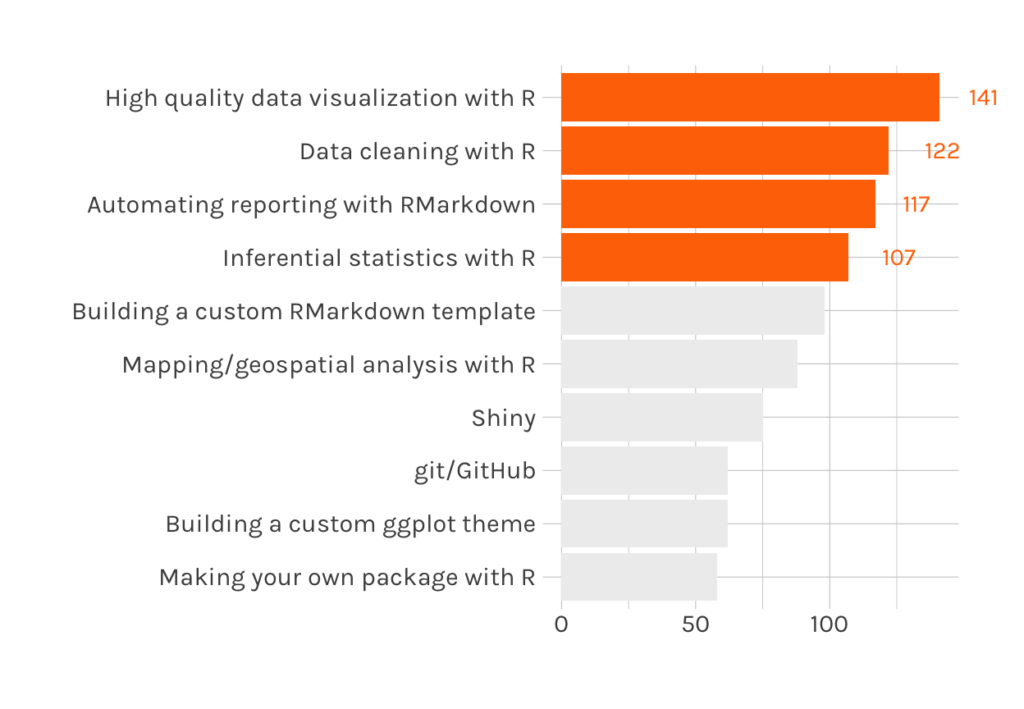
Finally, I asked what types of particular skills in R people would be interested in learning more about. I've developed a series of online courses for those starting our with R. But once you have the basics down, you often want to use R for particular purposes, and need some focused help to do this.
I asked what topics you'd be interested in diving deeper on. The most common response was doing high-quality data visualization with R, followed by data cleaning, automating reporting, and inferential stats. Some topics I expected to be higher up (e.g. mapping) got less interest.
There were also a series of open-ended questions, which I skimmed over in the live session (see >video below), but did analyze after the fact. These responses, in particular, helped me to understand why you like to learn in the ways that you do.
Those who said you like to learn through self-paced online courses mentioned the appeal of having demos, code, and videos that you can do at any time.
Those who said you like group online courses with regular meetings mentioned the accountability and motivation that comes from this format.
Those who prefer in-person workshopstalked about the appeal of taking focused time (literally) away from work to learn a new skill, as well as the benefit of getting immediate feedback to avoid small errors that can prove huge roadblocks (e.g. misplaced commas).
What's next for R for the Rest of Us
Having spent time analyzing and reflecting on what you told me (thanks again for taking the time to provide responses!), here's what I plan to do next with R for the Rest of Us:
First, I plan to finish the upcoming Going Deeper course. The COVID-19 pandemic has slowed my progress on this, but I am finally making a final push, and expect to have this out in May. I have incorporated your feedback to completely reshape how I'm teaching the data visualization section of this course, framing it around applying high-quality data viz principals in R.
I plan to start an office hours programwhere you can join live video sessions and get answers to your particular questions. A challenge many face is applying your R learning to your own work. This program will help you get answers to your questions so that you can fully embrace R.
I plan to test out a group cohort modelfor my existing online courses. While many of you like the current self-paced nature of the online courses I offer, others want the accountability and camaraderie that comes from learning in a group, and I want to support you in this.
I plan to partner with talented folks in the R community to offer focused courses on skills you want to dive deep on. There's a course on the inferential stats in R in the works, and it should be out this fall. I'm also working on finding partners to teach courses on other topics you're interested in. I hope to have more info on this soon.
When the current lockdown eases up, I also hope to resume doing in-person workshops like I did last fall. As with everything else right now, the timing of this is very much up in the air.
Those are my plans for offerings for individuals. I will continue to provide custom training for organizations that want to move to R so if that's your situation, please feel free to reach out.
Watch how I analyzed the survey responses
Not to get too meta, but I also did a live stream of myself analyzing the survey results (in R, of course). If you didn't join that live, you can watch the replay below. Here are a few of the things you'll see me do:
Create a report using RMarkdown and the distill package
Import my data directly from a Google Sheet using the googlesheets4 package
Use inline R code to dynamically create text in my RMarkdown document
Take questions where respondents gave multiple answers (i.e. check-all-that-apply type questions) and separate out the responses using the separate_rows() function
Summarize results with several tidyverse packages and make bar charts using ggplot to see frequency of responses
Create a function to make tables that display responses to open-ended questions
Sign up for the newsletter
Get blog posts like this delivered straight to your inbox.


You need to be signed-in to comment on this post. Login.